Fig. 4
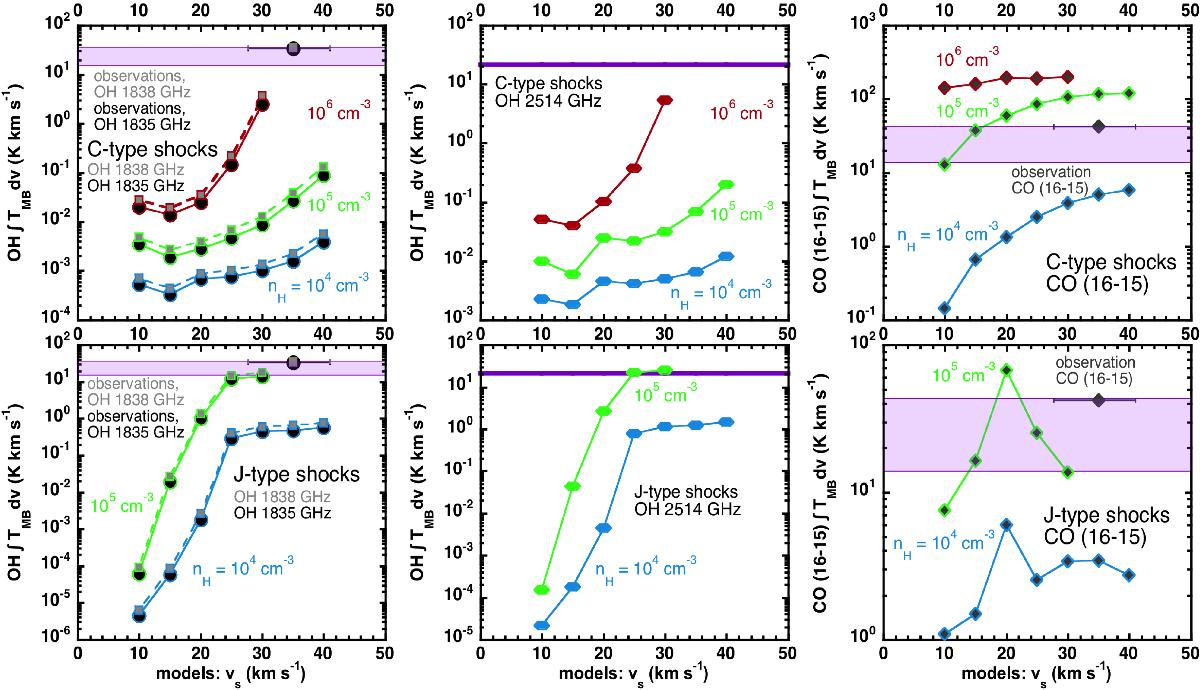
Comparisons of the integrated intensities (main beam temperature units) of all observed lines with the predictions of our grid of C-type (upper panels) and J-type (lower panels) models. In all panels, the abscissa is the shock velocity. In all panels, the colour symbols are the model predictions, where the red, blue, and green filled circles correspond to the pre-shock densities indicated in each panel. Finally, in all panels, the grey and black points are the observations integrated over the whole redshifted shock component (scenario 1, Sect. 5.1), while the pink area corresponds to the range of values that correspond to the LV and HV values, see Table 5, in turn corresponding to scenario 2, Sect. 5.2. In the central panels, the purple line is the observed intensity integrated between –90 and –20 km s-1. Left-hand side panels: OH at ~1835 GHz and ~1838 GHz. The computed 1835 GHz and 1838 GHz intensities are connected by continuous and broken curves, respectively. The observed intensities are indicated by black (1835 GHz) and grey (1838 GHz) points with horizontal bars, reflecting the uncertainty on the shock velocity; the uncertainty on the intensity are of the order of the points sizes (see text). Central panels: OH at ~2514 GHz. Right-hand side panels: CO (16–15).
Current usage metrics show cumulative count of Article Views (full-text article views including HTML views, PDF and ePub downloads, according to the available data) and Abstracts Views on Vision4Press platform.
Data correspond to usage on the plateform after 2015. The current usage metrics is available 48-96 hours after online publication and is updated daily on week days.
Initial download of the metrics may take a while.