Fig. 3
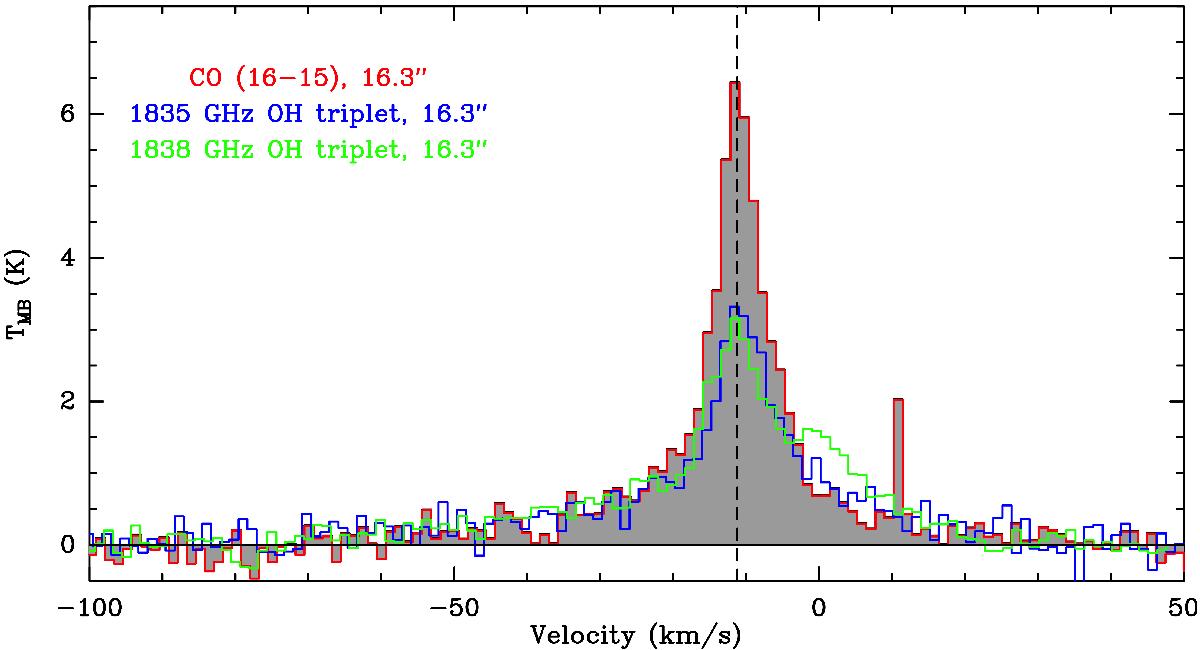
CO (16–15) transition (red line and grey histograms) at the Cep A HW2 position, overlaid with the 1835 GHz and 1838 GHz triplets (blue and green lines, from Fig. 2). The spatial and spectral resolutions of the CO line are 16.̋3 and 1.24 km s-1. The vertical dashed line is at the cloud νlsr of − 11.2 km s-1 (Narayanan & Walker 1996; Gómez et al. 1999).
Current usage metrics show cumulative count of Article Views (full-text article views including HTML views, PDF and ePub downloads, according to the available data) and Abstracts Views on Vision4Press platform.
Data correspond to usage on the plateform after 2015. The current usage metrics is available 48-96 hours after online publication and is updated daily on week days.
Initial download of the metrics may take a while.