Fig. 3
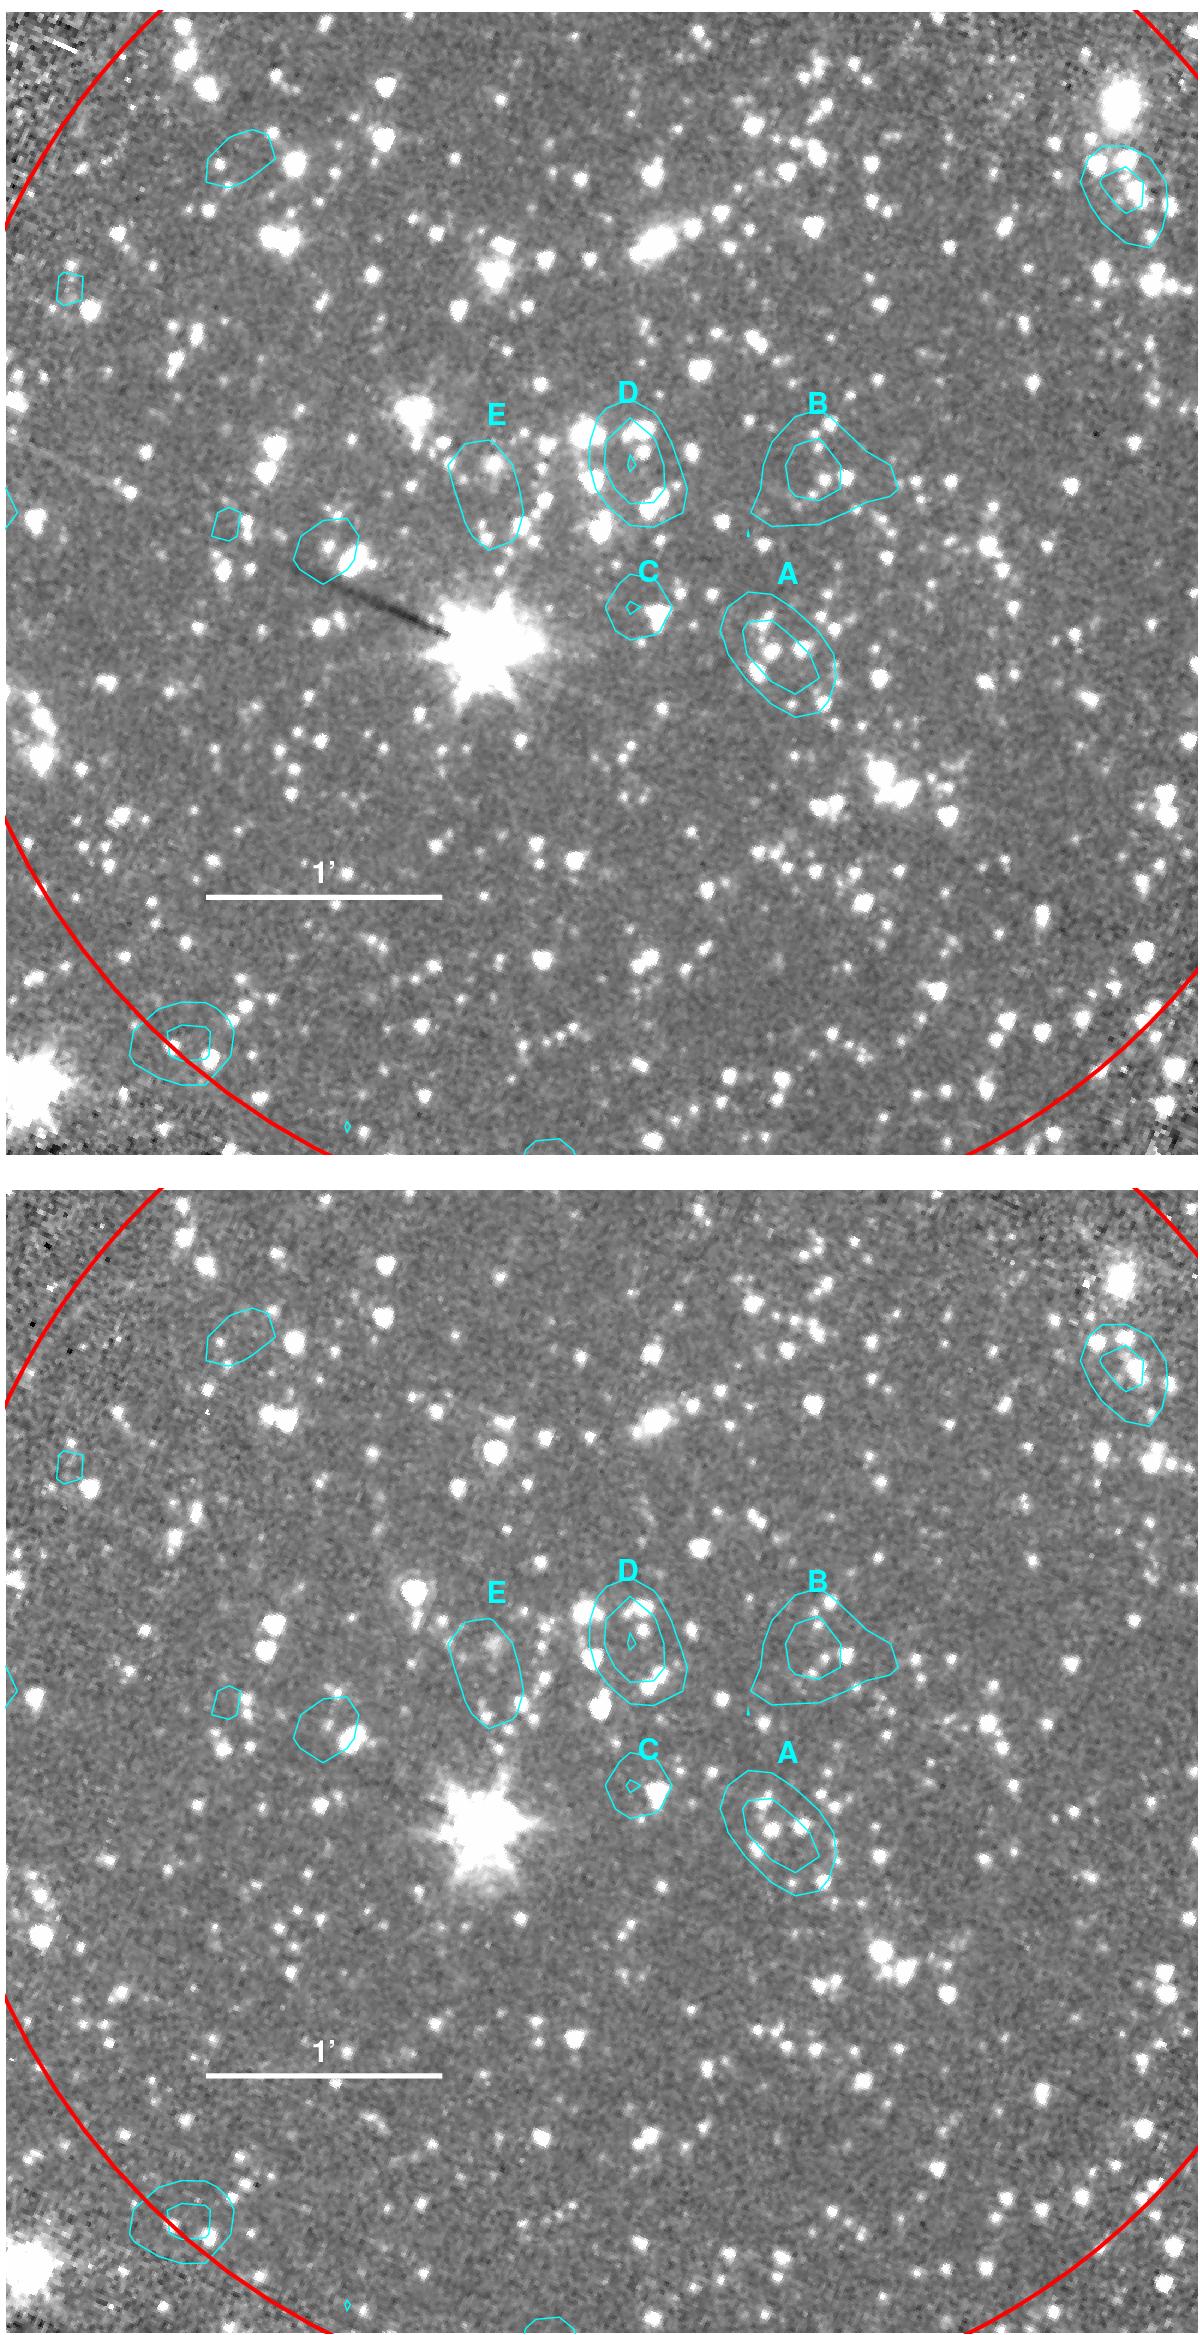
IRAC 3.6 μm (top) and 4.5 μm (bottom) 5′ × 5′ images around PHz G95.5−61.6, with the contours of the Herschel/SPIRE 250 μm map over-plotted in cyan. These contours correspond to deviations of 2, 3, and 4σ. The five Herschel/SPIRE sources are labelled. A red circle of 3′-radius shows the deepest area, common to the two channels that we used for the analysis. North is up, east is left.
Current usage metrics show cumulative count of Article Views (full-text article views including HTML views, PDF and ePub downloads, according to the available data) and Abstracts Views on Vision4Press platform.
Data correspond to usage on the plateform after 2015. The current usage metrics is available 48-96 hours after online publication and is updated daily on week days.
Initial download of the metrics may take a while.