Fig. 2
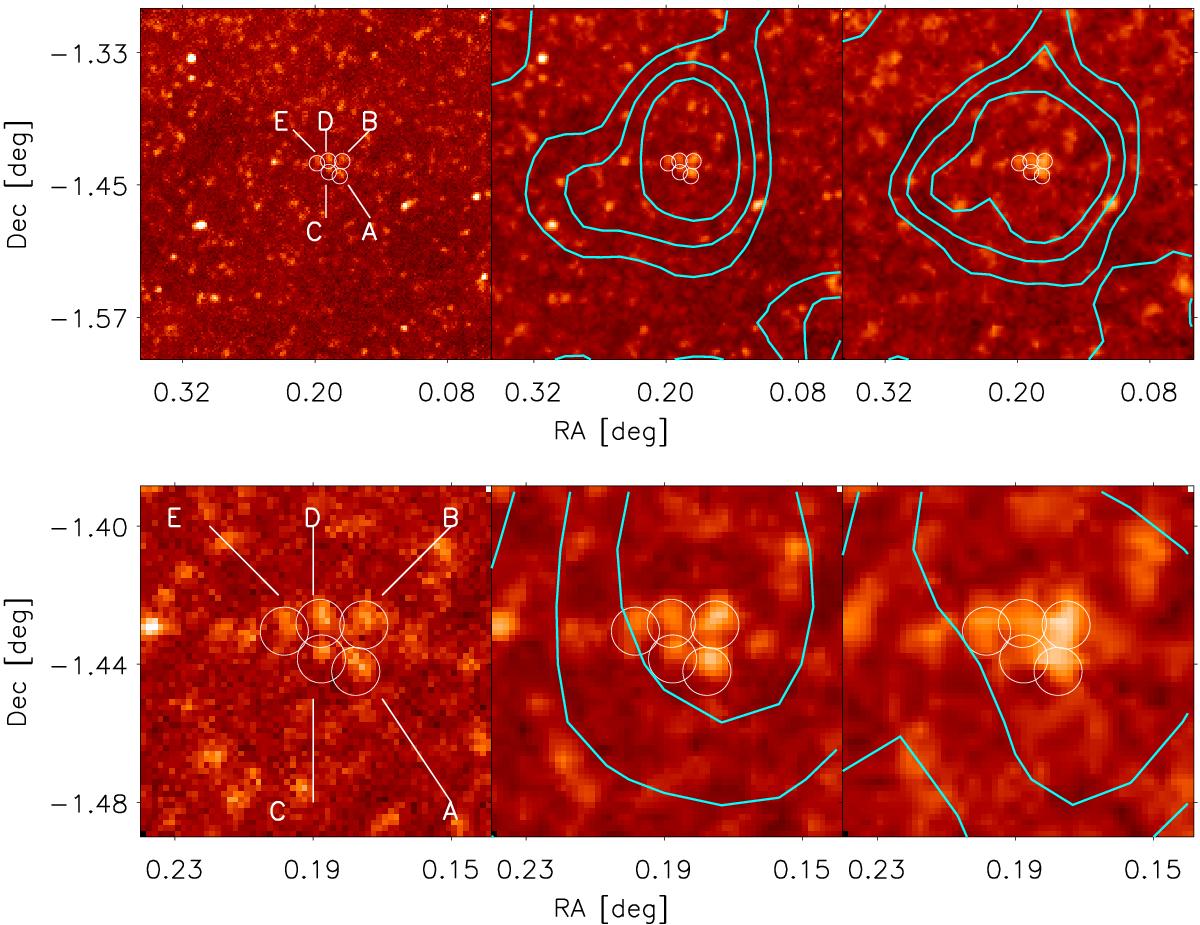
Top row: from left to right: Herschel/SPIRE 19′ × 19′ images at 250, 350, and 500 μm containing PHz G95.5−61.6. The colour scales of these maps go from 0 to 10.0 MJy sr-1, 5.5 MJy sr-1 and 2.5 MJy sr-1 for 250, 350, and 500 μm, respectively. The contours of the Planck maps at 350 and 550 μm are over-plotted in cyan onto the SPIRE 350 and 500 μm maps, respectively. The three levels correspond to 60%, 40%, and 20% of the local maximum in the Planck maps. The Herschel/SPIRE point sources within the Planck ~5′ beam are indicated with white circles, and labelled A, B, C, D, and E on the 250 μm map. Bottom row: a zoomed-in view into an area of 6′ × 6′ on source. An additional level (80%) has been added to the Planck contours.
Current usage metrics show cumulative count of Article Views (full-text article views including HTML views, PDF and ePub downloads, according to the available data) and Abstracts Views on Vision4Press platform.
Data correspond to usage on the plateform after 2015. The current usage metrics is available 48-96 hours after online publication and is updated daily on week days.
Initial download of the metrics may take a while.