Fig. 13
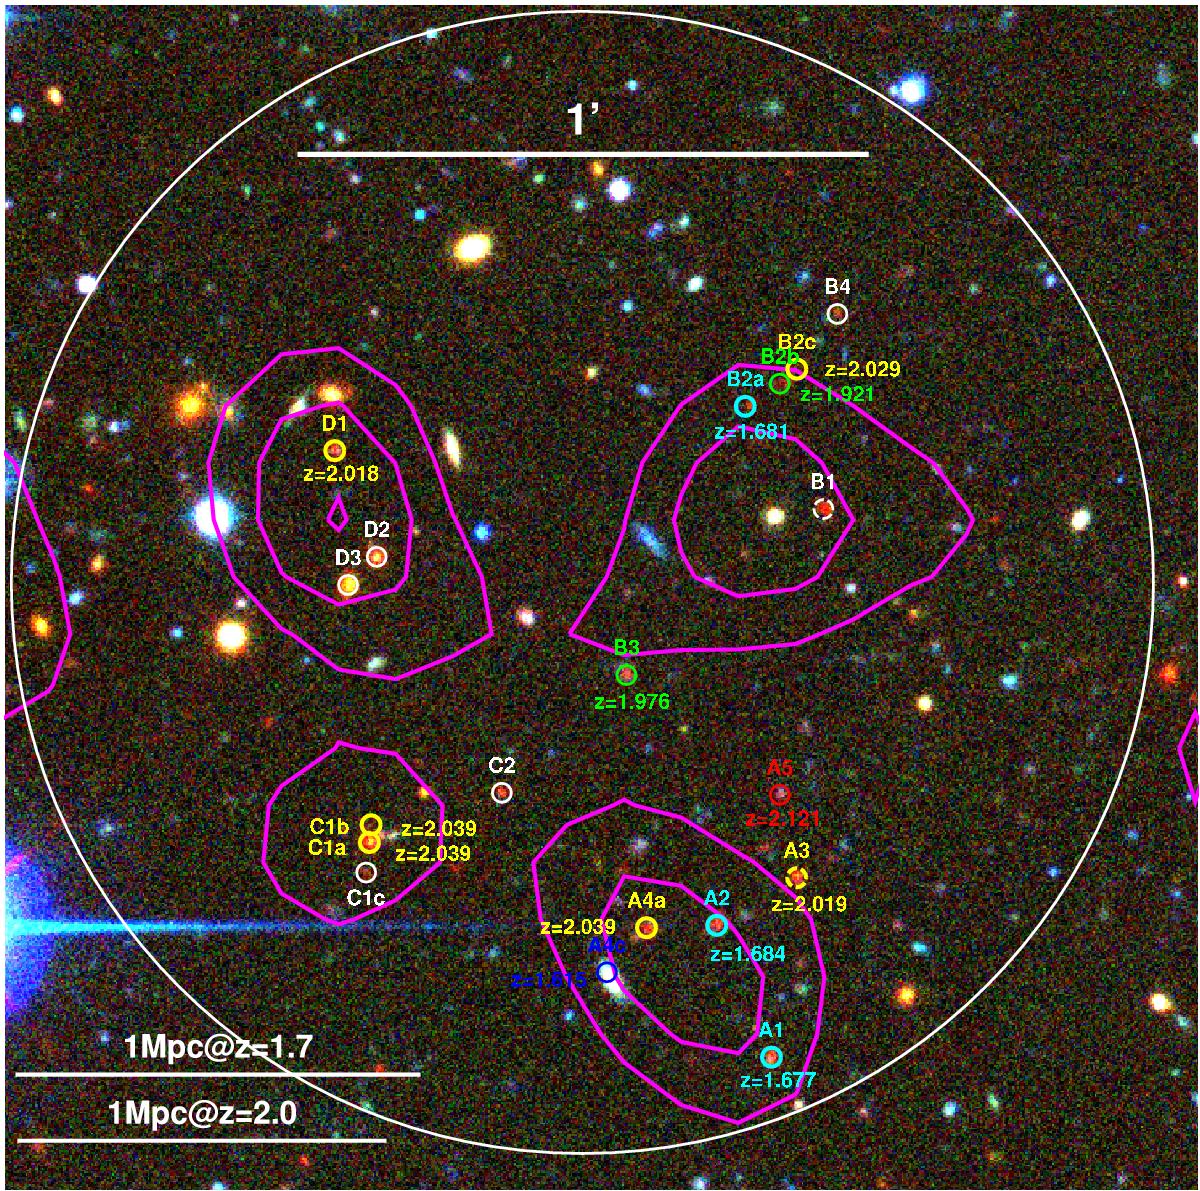
Zoom-in from Fig. 4, showing the location of the spectroscopically observed galaxies. The contours of the 250 μm Herschel/SPIRE map are over-plotted in magenta. These galaxies have been colour-coded according to their spectroscopic redshifts (also included in the figure), from dark blue (closest galaxy, i.e. A4c, z = 1.615) to red (furthest, A5, z = 2.121). The members of the two high-z structures are then shown in cyan (z ≃ 1.7) and yellow (z ≃ 2.0). The galaxies for which we could not determine their spectroscopic redshifts (B1, B4, C2, D2, and D3) are marked in white. For reference, a circle of 1′ radius, centred at RA = 00:00:43.31 and Dec = − 01:25:50.5, is shown in white. In addition, the scales corresponding to a comoving size of 1 Mpc at z ≃ 1.7 and z ≃ 2.0 are also shown in the bottom left corner. North is up and east is left.
Current usage metrics show cumulative count of Article Views (full-text article views including HTML views, PDF and ePub downloads, according to the available data) and Abstracts Views on Vision4Press platform.
Data correspond to usage on the plateform after 2015. The current usage metrics is available 48-96 hours after online publication and is updated daily on week days.
Initial download of the metrics may take a while.