Fig. 12
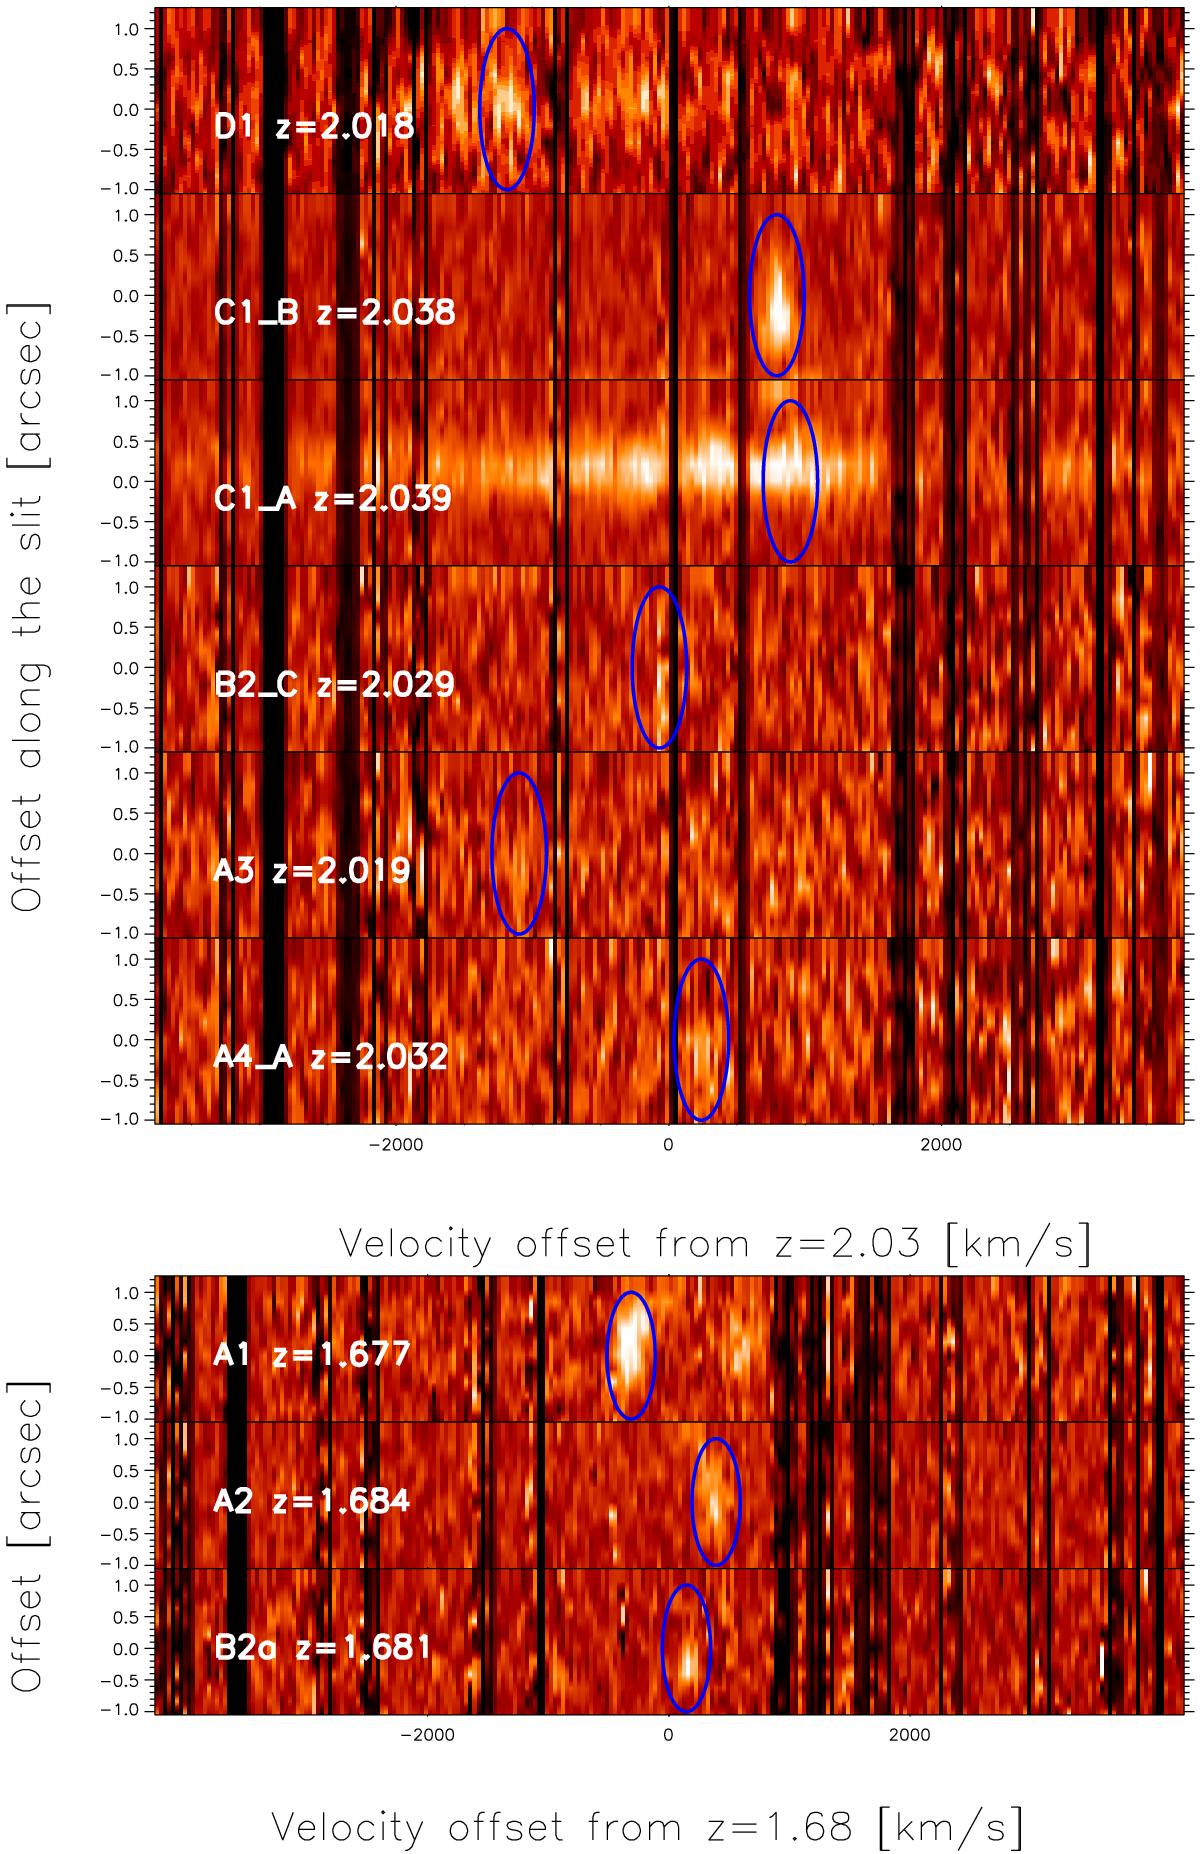
Zoomed-in view of the 2D spectra obtained with VLT/X-Shooter for those galaxies that are spectroscopically identified as members of any of the two galaxy systems set at (systemic redshift) z ≃ 2.03 (top panel) and z ≃ 1.68 (bottom panel). The spectra are shifted accordingly to show the velocity offset with respect to the systemic recession velocity in correspondence of the Hαλ6564 emission line, indicated by a blue ellipse. For A1 and D1, the contiguous [NII]λ6584 emission line can also (hardly) be seen. For C1a the Hα emission line is broad and blended with some contribution from the [NII]λ6550 and λ6584 lines, for a total width of more than 200 Å. For display purposes, known sky lines have been masked with a width of 0.2 nm and the colour range has been adapted for each source to maximise clarity. However, we have consistently identified the spectral features in non-masked versions of the spectra.
Current usage metrics show cumulative count of Article Views (full-text article views including HTML views, PDF and ePub downloads, according to the available data) and Abstracts Views on Vision4Press platform.
Data correspond to usage on the plateform after 2015. The current usage metrics is available 48-96 hours after online publication and is updated daily on week days.
Initial download of the metrics may take a while.