Fig. 11
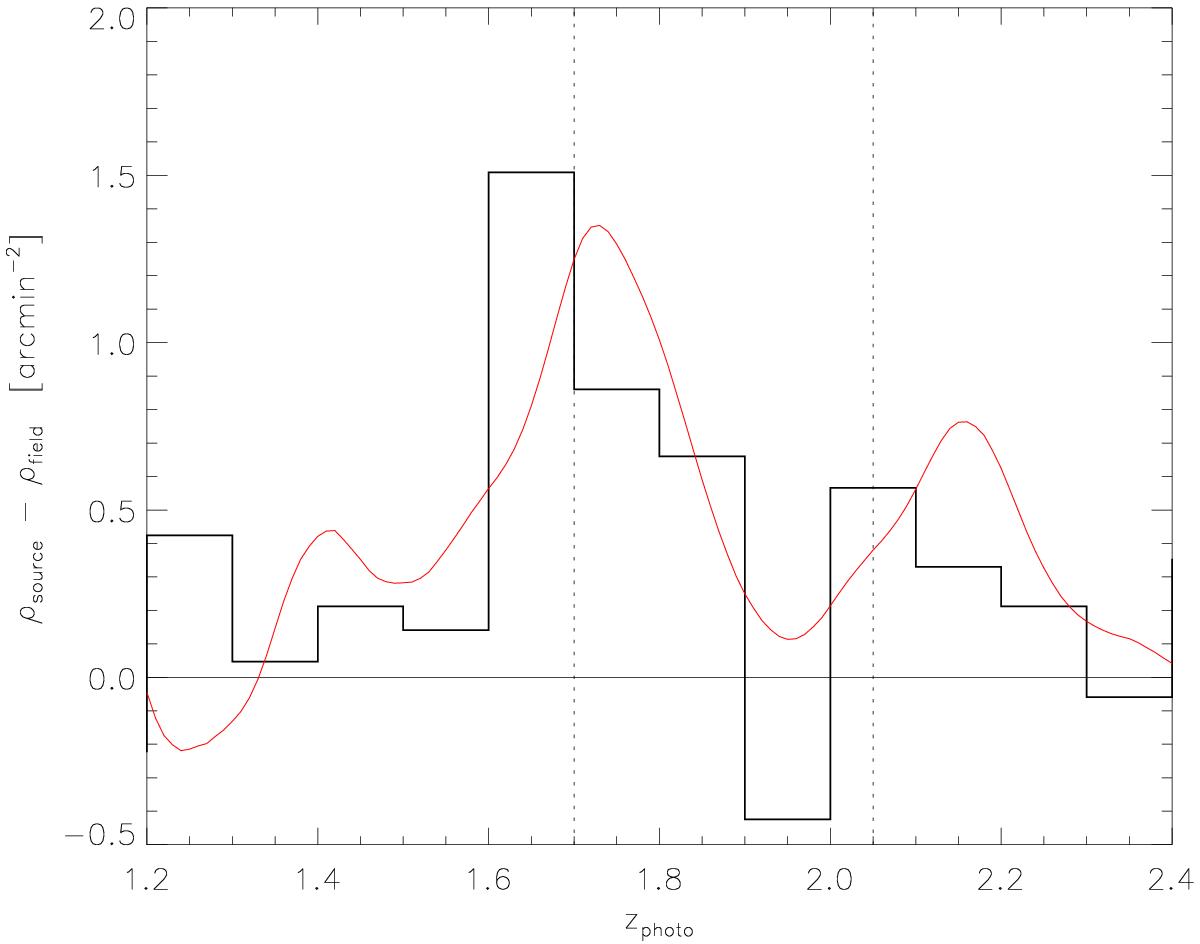
Excess in the photometric redshift distribution of galaxies within 1′ from PHz G95.5−61.6 with respect to that obtained for the rest of the field. The red line is the sum of the photometric redshift probability distribution functions for the same objects. The existence of a broad peak, consistent with the two systemic redshifts, spectroscopically obtained from the X-Shooter data (vertical dashed lines), is suggested, with about 20 sources in this overdensity.
Current usage metrics show cumulative count of Article Views (full-text article views including HTML views, PDF and ePub downloads, according to the available data) and Abstracts Views on Vision4Press platform.
Data correspond to usage on the plateform after 2015. The current usage metrics is available 48-96 hours after online publication and is updated daily on week days.
Initial download of the metrics may take a while.