Fig. 10
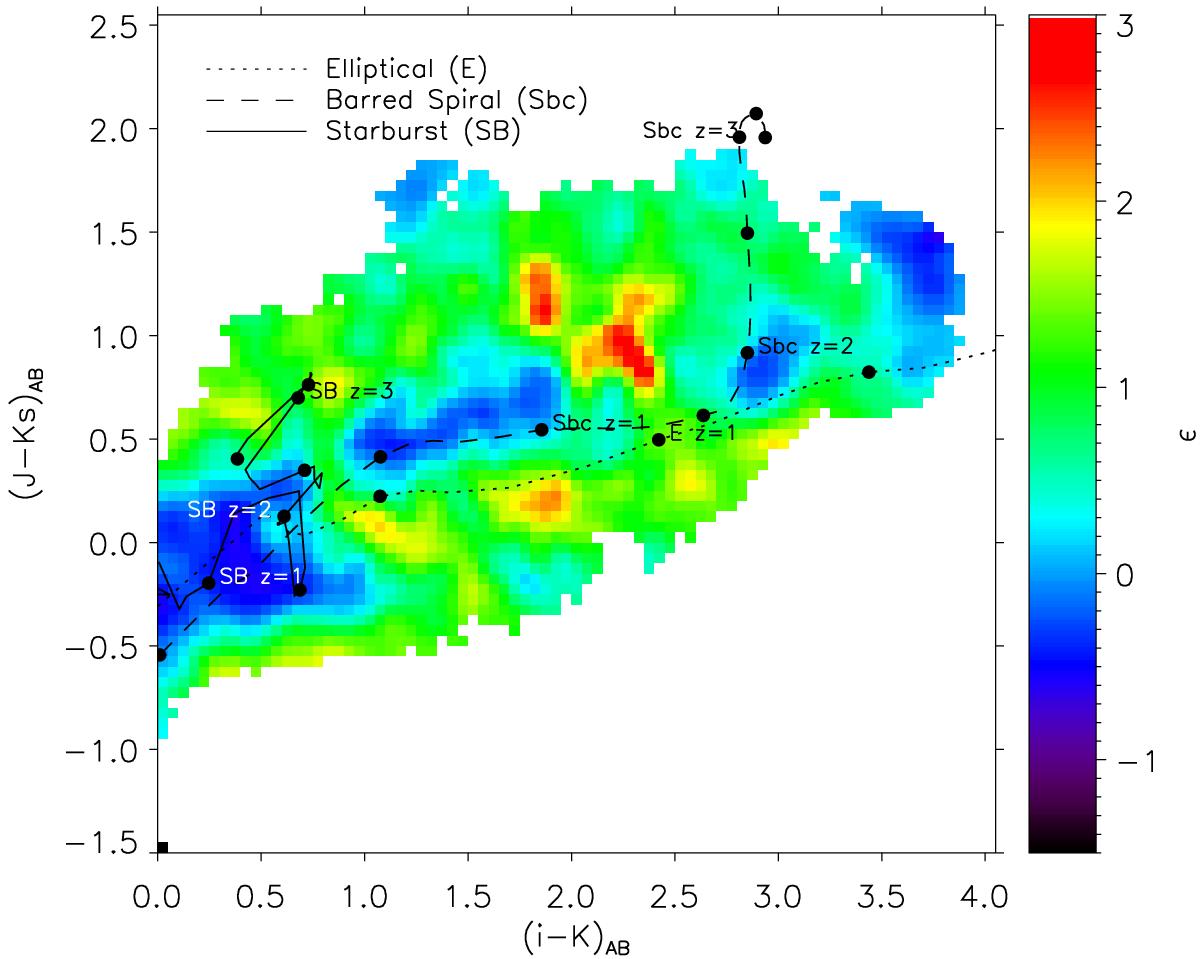
Comparison of the galaxy distribution in the i − Ks versus J − Ks diagram for the circular region of 1′-radius containing the five Herschel/SPIRE sources and a region external to it (i.e. the “field”). An excess (ϵ, see Eq. (2)) of galaxies with i − Ks ~ 2.3 and J − Ks ~ 0.8 is detected at the location of PHz G95.5−61.6 with respect to the field (see text for further details). For visualisation purposes, the map has been smoothed with a Gaussian beam of two pixels. Tracks that describe the colours for three typical SED templates of local galaxies, observed from z = 0 to z = 4, are over-plotted. For each track, filled black circles indicate the loci at a redshift step of 0.5, with added labels at redshifts 1, 2, and 3.
Current usage metrics show cumulative count of Article Views (full-text article views including HTML views, PDF and ePub downloads, according to the available data) and Abstracts Views on Vision4Press platform.
Data correspond to usage on the plateform after 2015. The current usage metrics is available 48-96 hours after online publication and is updated daily on week days.
Initial download of the metrics may take a while.