Fig. 1
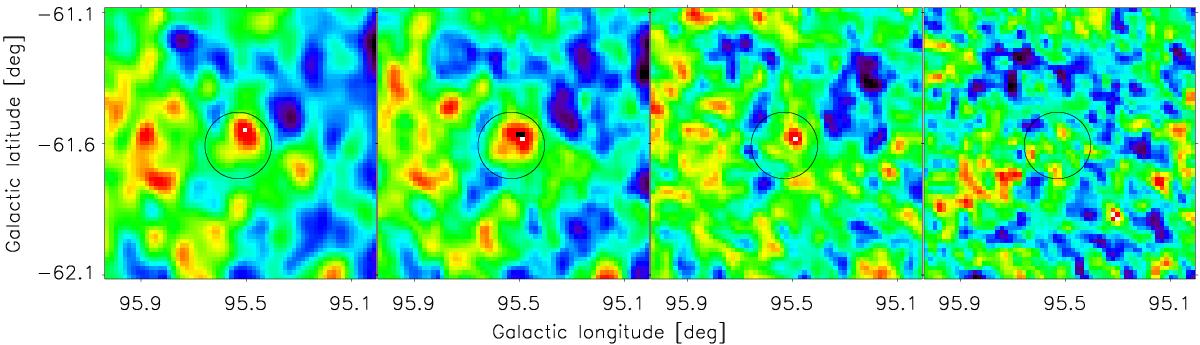
From left to right: Planck 1deg×1deg intensity maps at 350, 550, 850, and 1380 μm (i.e., 857, 545, 353, and 217 GHz, respectively) centred on the high-z candidate PHz G95.5−61.6. Their individual ranges are as follows: ± 0.4 MJy sr-1 (350 μm), ± 0.2 MJy sr-1 (550 μm), ± 0.1 MJy sr-1 (850 μm), and ± 0.05 MJy sr-1 (1380 μm). In each panel, a circle with radius equal to the FWHM of the source (i.e. 7.2′) is centred on the Planck position, measured on the sky-region with excess emission after the detection process (see Sects. 2.2 and 2.3).
Current usage metrics show cumulative count of Article Views (full-text article views including HTML views, PDF and ePub downloads, according to the available data) and Abstracts Views on Vision4Press platform.
Data correspond to usage on the plateform after 2015. The current usage metrics is available 48-96 hours after online publication and is updated daily on week days.
Initial download of the metrics may take a while.