Fig. 8
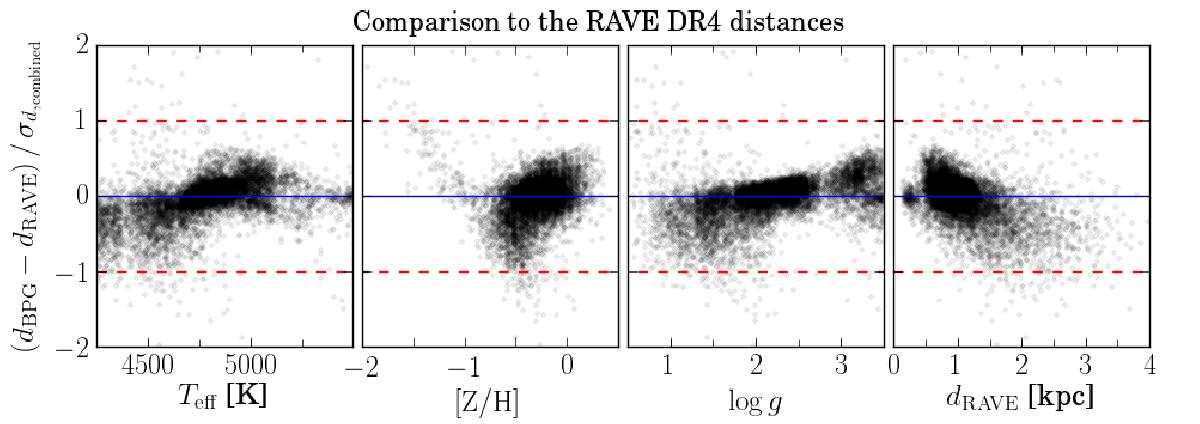
Comparison of our distance estimates against the RAVE DR4 distances from Binney et al. (2014a) for the high-S/N sample of Boeche et al. (2013a). In each panel the vertical axis shows the absolute distance residuals normalised to the combined uncertainty from both methods, ![]() , as a function of the main spectroscopic parameters Teff, [Z/H] and log g as well as the RAVE distance, dRAVE.
, as a function of the main spectroscopic parameters Teff, [Z/H] and log g as well as the RAVE distance, dRAVE.
Current usage metrics show cumulative count of Article Views (full-text article views including HTML views, PDF and ePub downloads, according to the available data) and Abstracts Views on Vision4Press platform.
Data correspond to usage on the plateform after 2015. The current usage metrics is available 48-96 hours after online publication and is updated daily on week days.
Initial download of the metrics may take a while.