Fig. 3
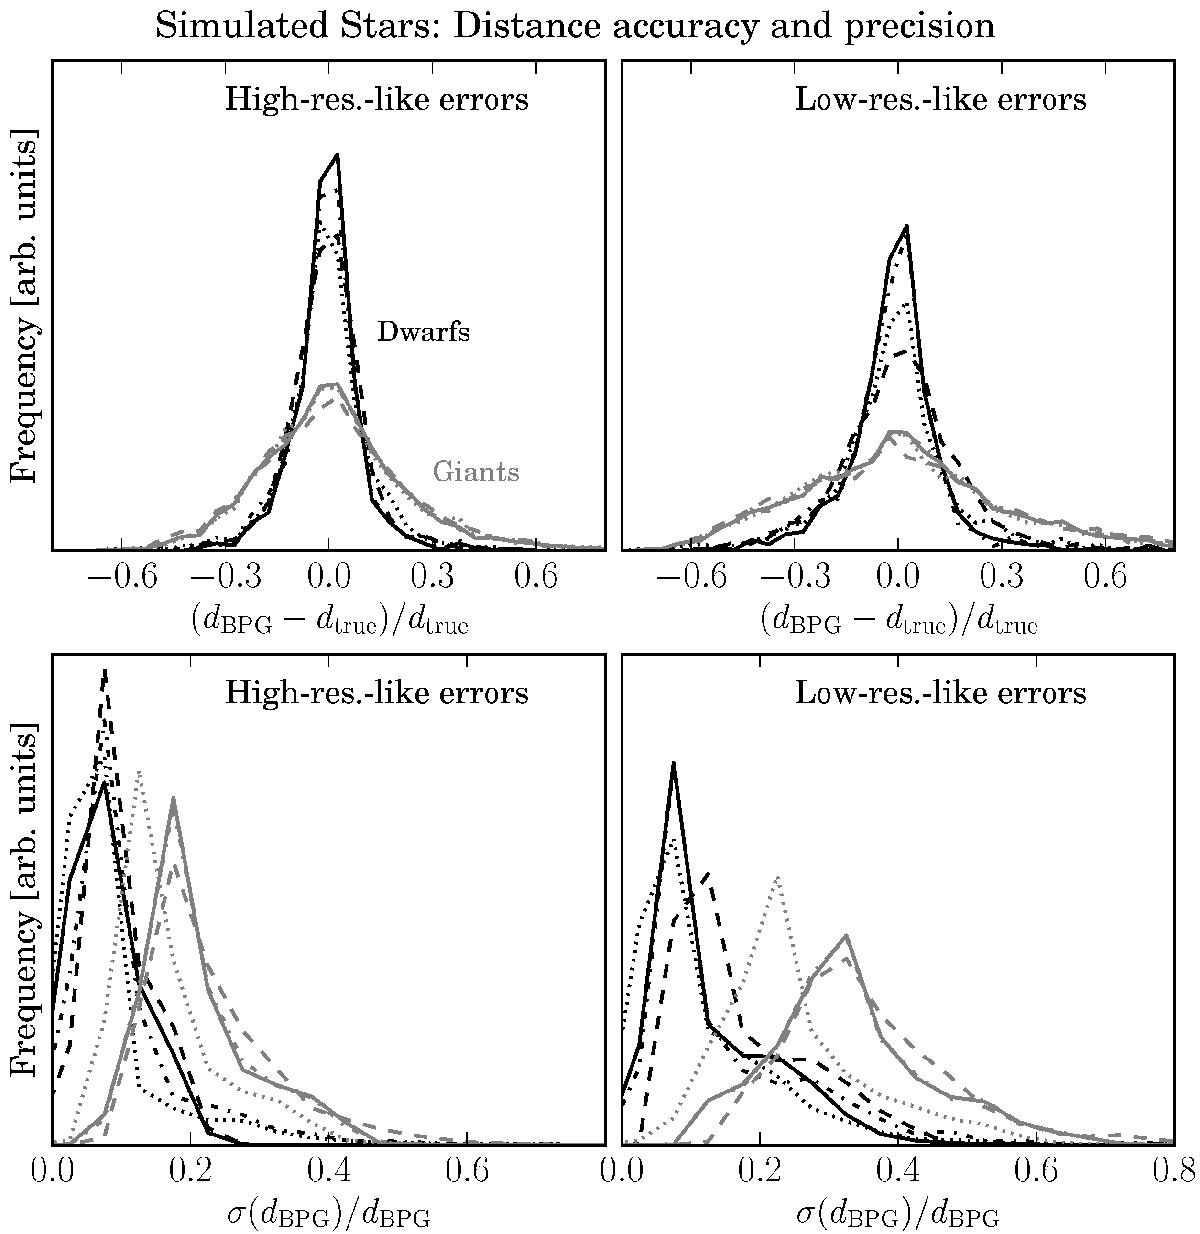
Distance accuracy and precision for the four input observable sets introduced in Sect. 2.4. Upper panels: distribution of relative distance errors, (dBPG−dtrue) /dtrue, for the sample of simulated stars drawn from PARSEC models (see Fig. 1) with high-resolution-like observational errors (left; see Sect. 2.2) and low-resolution-like errors (right). In each panel, we use the distances based on the four sets of measured parameters listed in Sect. 2.4. The results for dwarfs are shown in black, the results for the giants in grey. Solid lines: set 1 (x = {[M/H] ,Teff,log g,m,colours}); dashed lines: set 2 (x = {[M/H] ,Teff,log g,m}); dash-dotted lines: set 3 (x = {[M/H] ,log g,m,colours}); dotted lines: set 4 (x = {[M/H] ,m,colours}, with a cut at | Δlog g | < 0.5 dex). Bottom panels: distributions of our relative (internal) distance uncertainties, σ(dBPG) /dBPG.
Current usage metrics show cumulative count of Article Views (full-text article views including HTML views, PDF and ePub downloads, according to the available data) and Abstracts Views on Vision4Press platform.
Data correspond to usage on the plateform after 2015. The current usage metrics is available 48-96 hours after online publication and is updated daily on week days.
Initial download of the metrics may take a while.