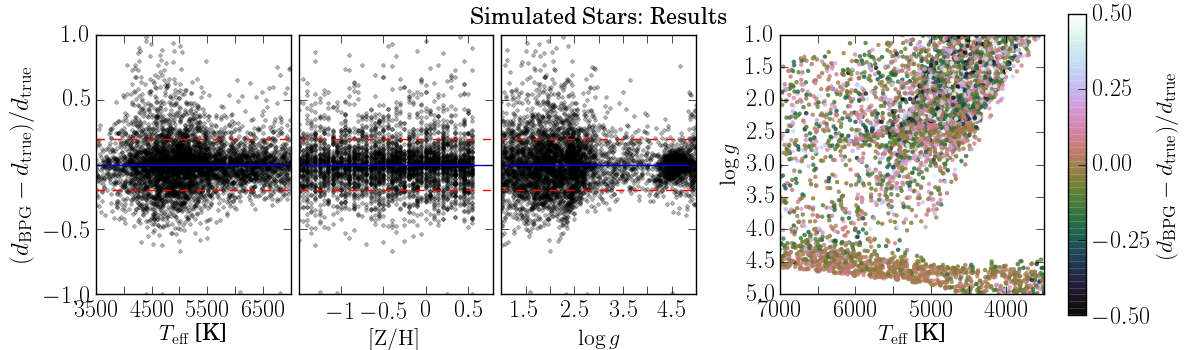
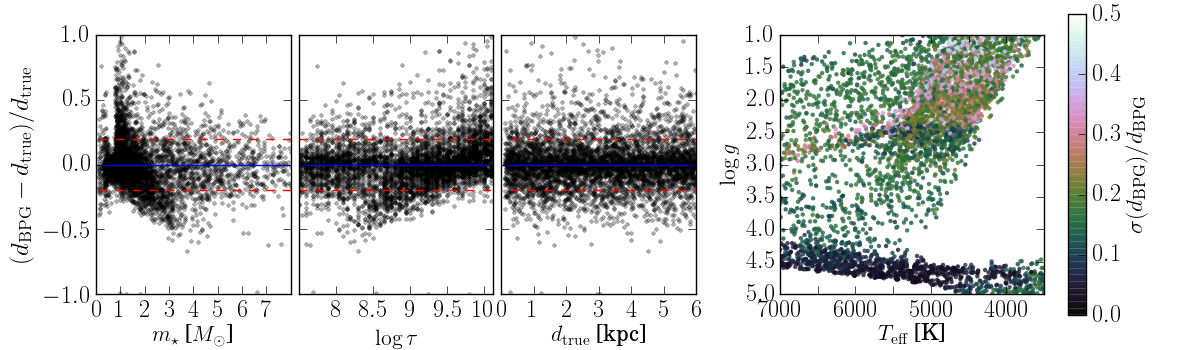
Fig. 2
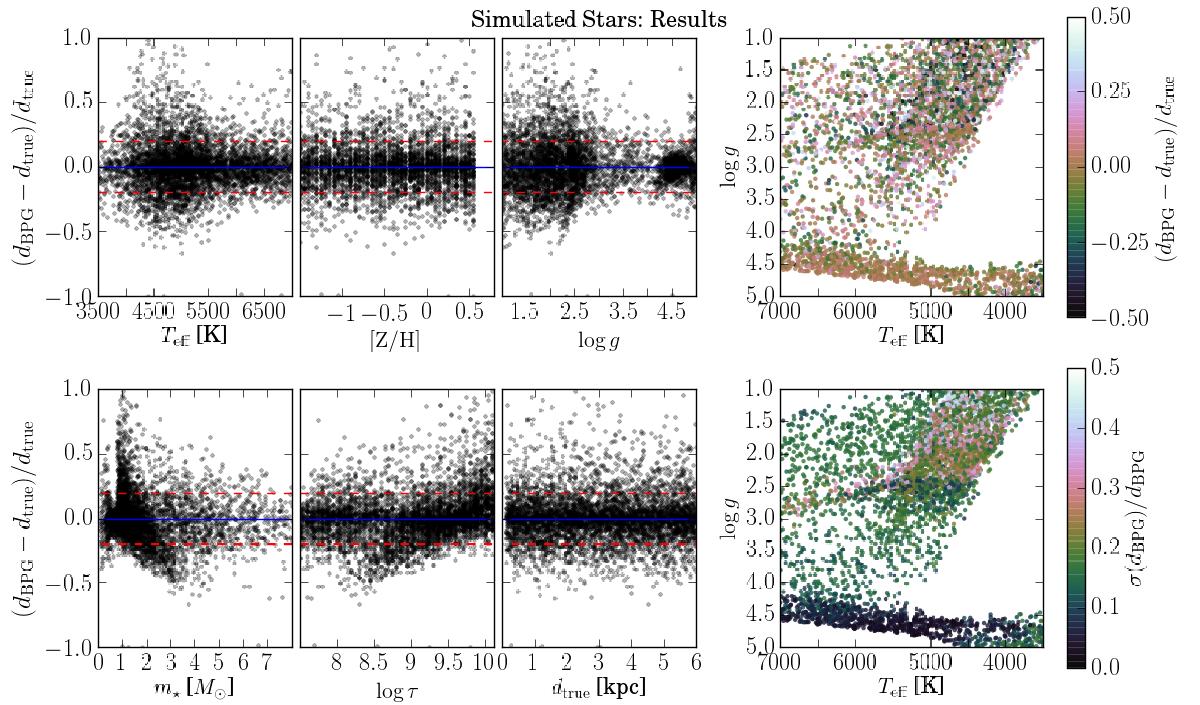
Results from the test with the simulated PARSEC sample with high-resolution-like observational errors (see Sect. 2.2; eTeff = 100 K, e[Z/H] = 0.1 dex, elog g = 0.1 dex, and emobs = 0.01 mag), using the full input parameter set (set 1: x = {[M/H] ,Teff,log g,m,colours}). Left six panels: relative distance errors (observed – true) of the simulated stars shown as a function of the (true) main stellar model parameters Teff, [M/H], log g, mass m⋆, age τ, and distance dtrue. The solid line marks the identity line, dashed lines indicate distance deviations of 20%. Upper right panel: relative distance error distribution in the Teff− log g diagram. Lower right panel: relative distance uncertainty distribution in the Teff− log g diagram. Clearly, distances to giant stars are much more prone to systematics and have larger uncertainties.
Current usage metrics show cumulative count of Article Views (full-text article views including HTML views, PDF and ePub downloads, according to the available data) and Abstracts Views on Vision4Press platform.
Data correspond to usage on the plateform after 2015. The current usage metrics is available 48-96 hours after online publication and is updated daily on week days.
Initial download of the metrics may take a while.