Free Access
Fig. 5
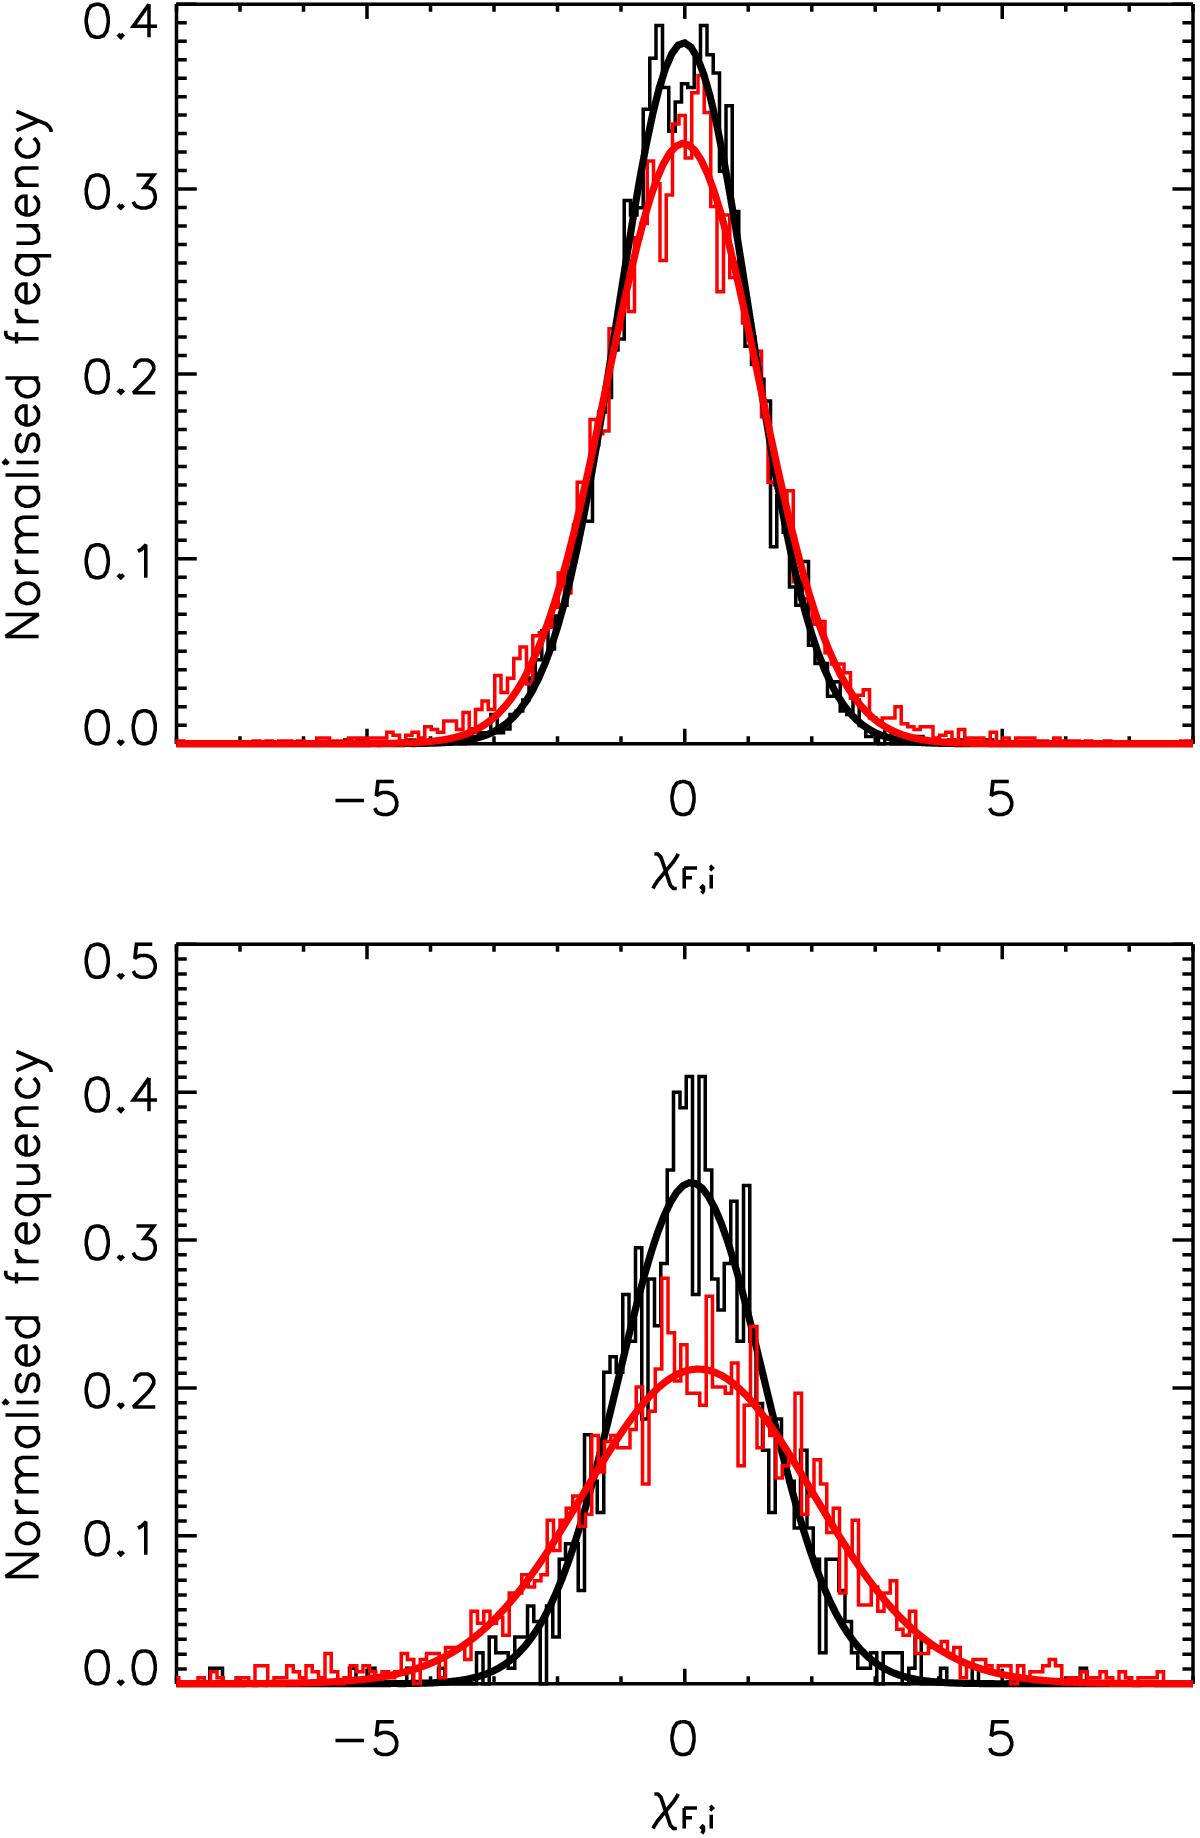
Distribution of ![]() for VIS arm (top) and first part of NIR arm (bottom), both with Gaussian fit. Black: regions without telluric lines in the uncorrected spectrum and red: regions with telluric lines in the uncorrected spectrum.
for VIS arm (top) and first part of NIR arm (bottom), both with Gaussian fit. Black: regions without telluric lines in the uncorrected spectrum and red: regions with telluric lines in the uncorrected spectrum.
This figure is made of several images, please see below:
Current usage metrics show cumulative count of Article Views (full-text article views including HTML views, PDF and ePub downloads, according to the available data) and Abstracts Views on Vision4Press platform.
Data correspond to usage on the plateform after 2015. The current usage metrics is available 48-96 hours after online publication and is updated daily on week days.
Initial download of the metrics may take a while.