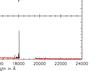
Fig. 4
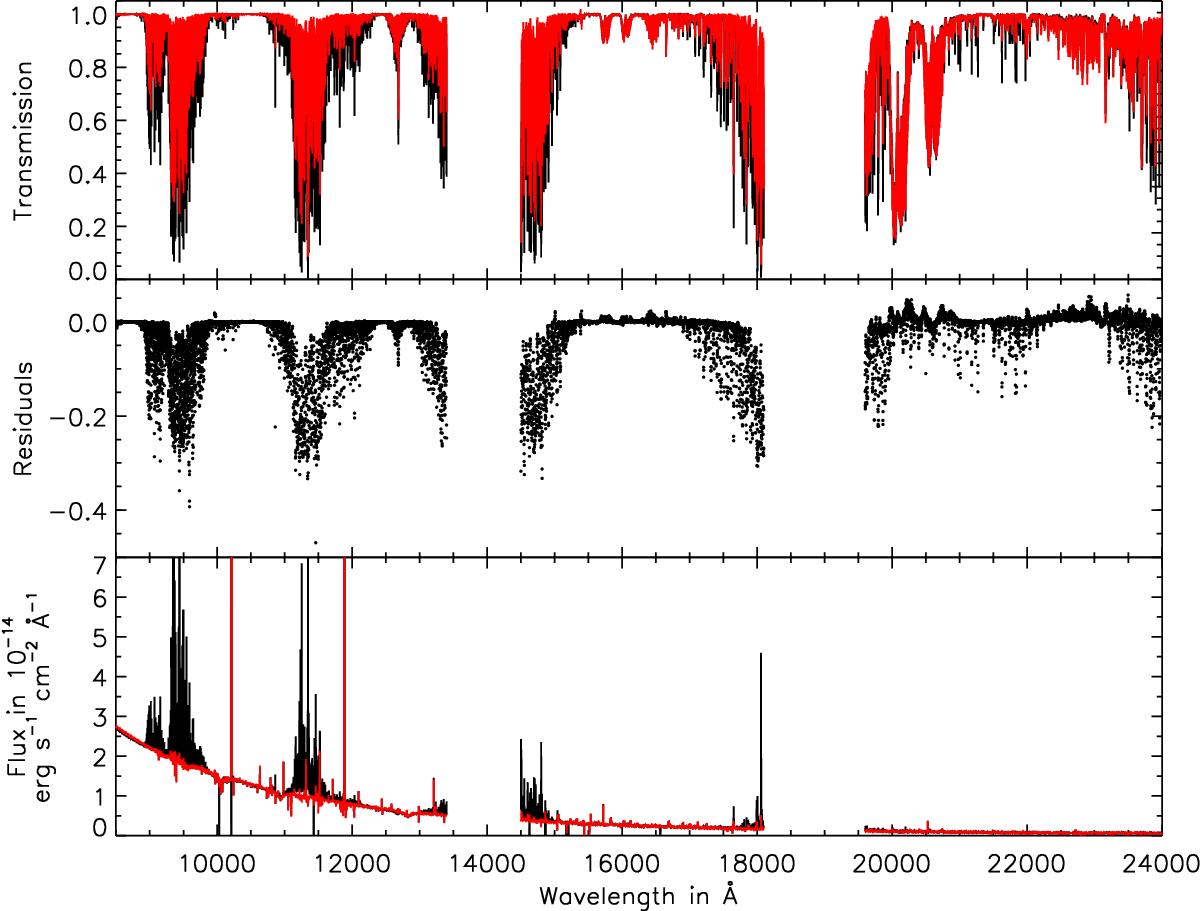
Comparison of the telluric model calculated for EG 274 (red) and a standard ATRAN model (black) in the upper panel and the residuals (ATRAN model minus EG 274 model) in the middle panel. The bottom panel shows the spectrum of EG 274 corrected with the standard ATRAN model (black) and corrected with the telluric model specifically calculated for it (red).
Current usage metrics show cumulative count of Article Views (full-text article views including HTML views, PDF and ePub downloads, according to the available data) and Abstracts Views on Vision4Press platform.
Data correspond to usage on the plateform after 2015. The current usage metrics is available 48-96 hours after online publication and is updated daily on week days.
Initial download of the metrics may take a while.