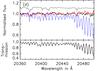
Fig. 2
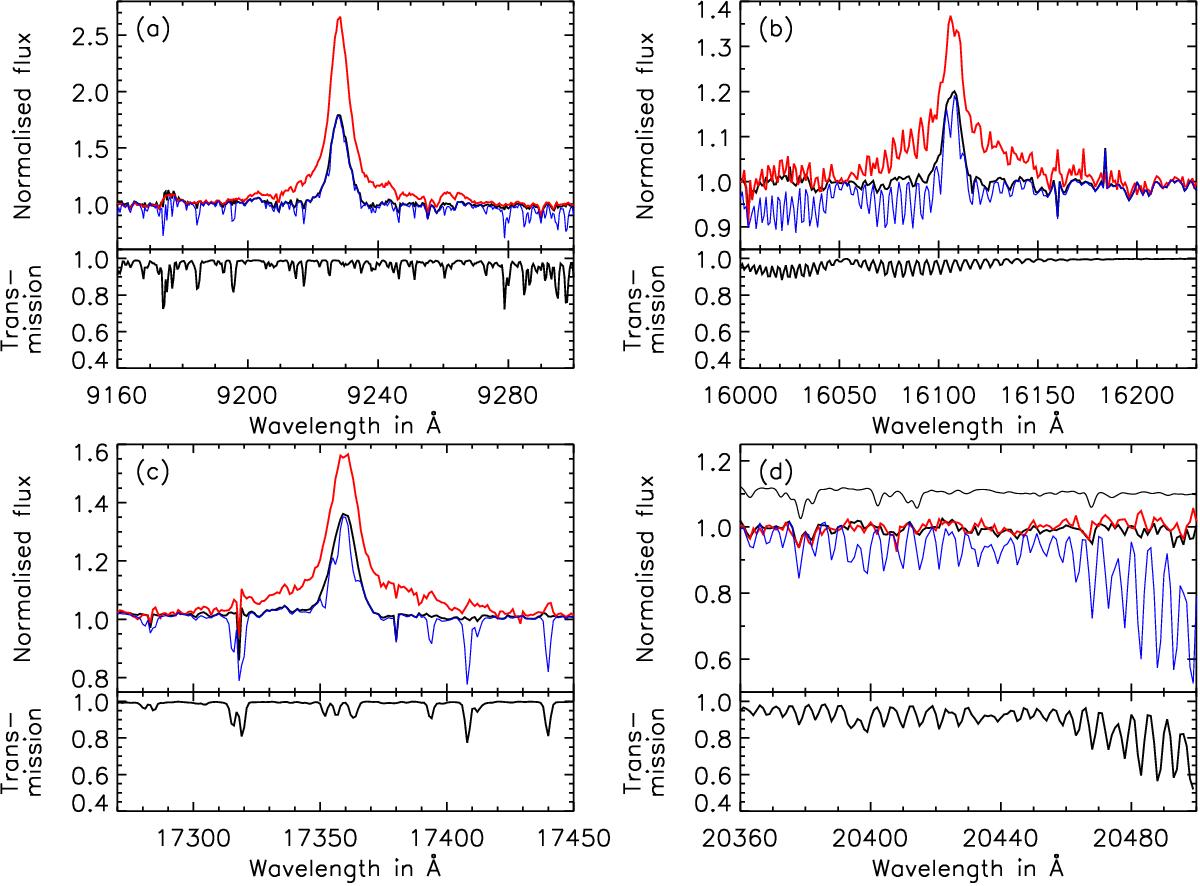
Examples of telluric line removal leaving no discernible systematic residuals. This statement is quantified in Sect. 4.4. Corrected spectrum (black) and for comparison the original spectrum (thin blue), as well as the spectrum corrected using IRAF (red) in the upper panels normalised for better comparability, as well as the corresponding telluric model in the lower panels of the individual plots: hydrogen lines a) Paschen 9 of CTTS V895 Sco, b) Brackett 13, and c) 10 of CTTS S CrA, as well as d) continuum region of WTTS MV Lup. In the upper panel of subplot d) a PHOENIX model for Teff = 4800 K (thin black) is also shown (shifted up by 0.1 for clarity).
Current usage metrics show cumulative count of Article Views (full-text article views including HTML views, PDF and ePub downloads, according to the available data) and Abstracts Views on Vision4Press platform.
Data correspond to usage on the plateform after 2015. The current usage metrics is available 48-96 hours after online publication and is updated daily on week days.
Initial download of the metrics may take a while.