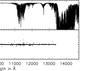
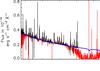
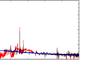
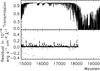
Fig. 1
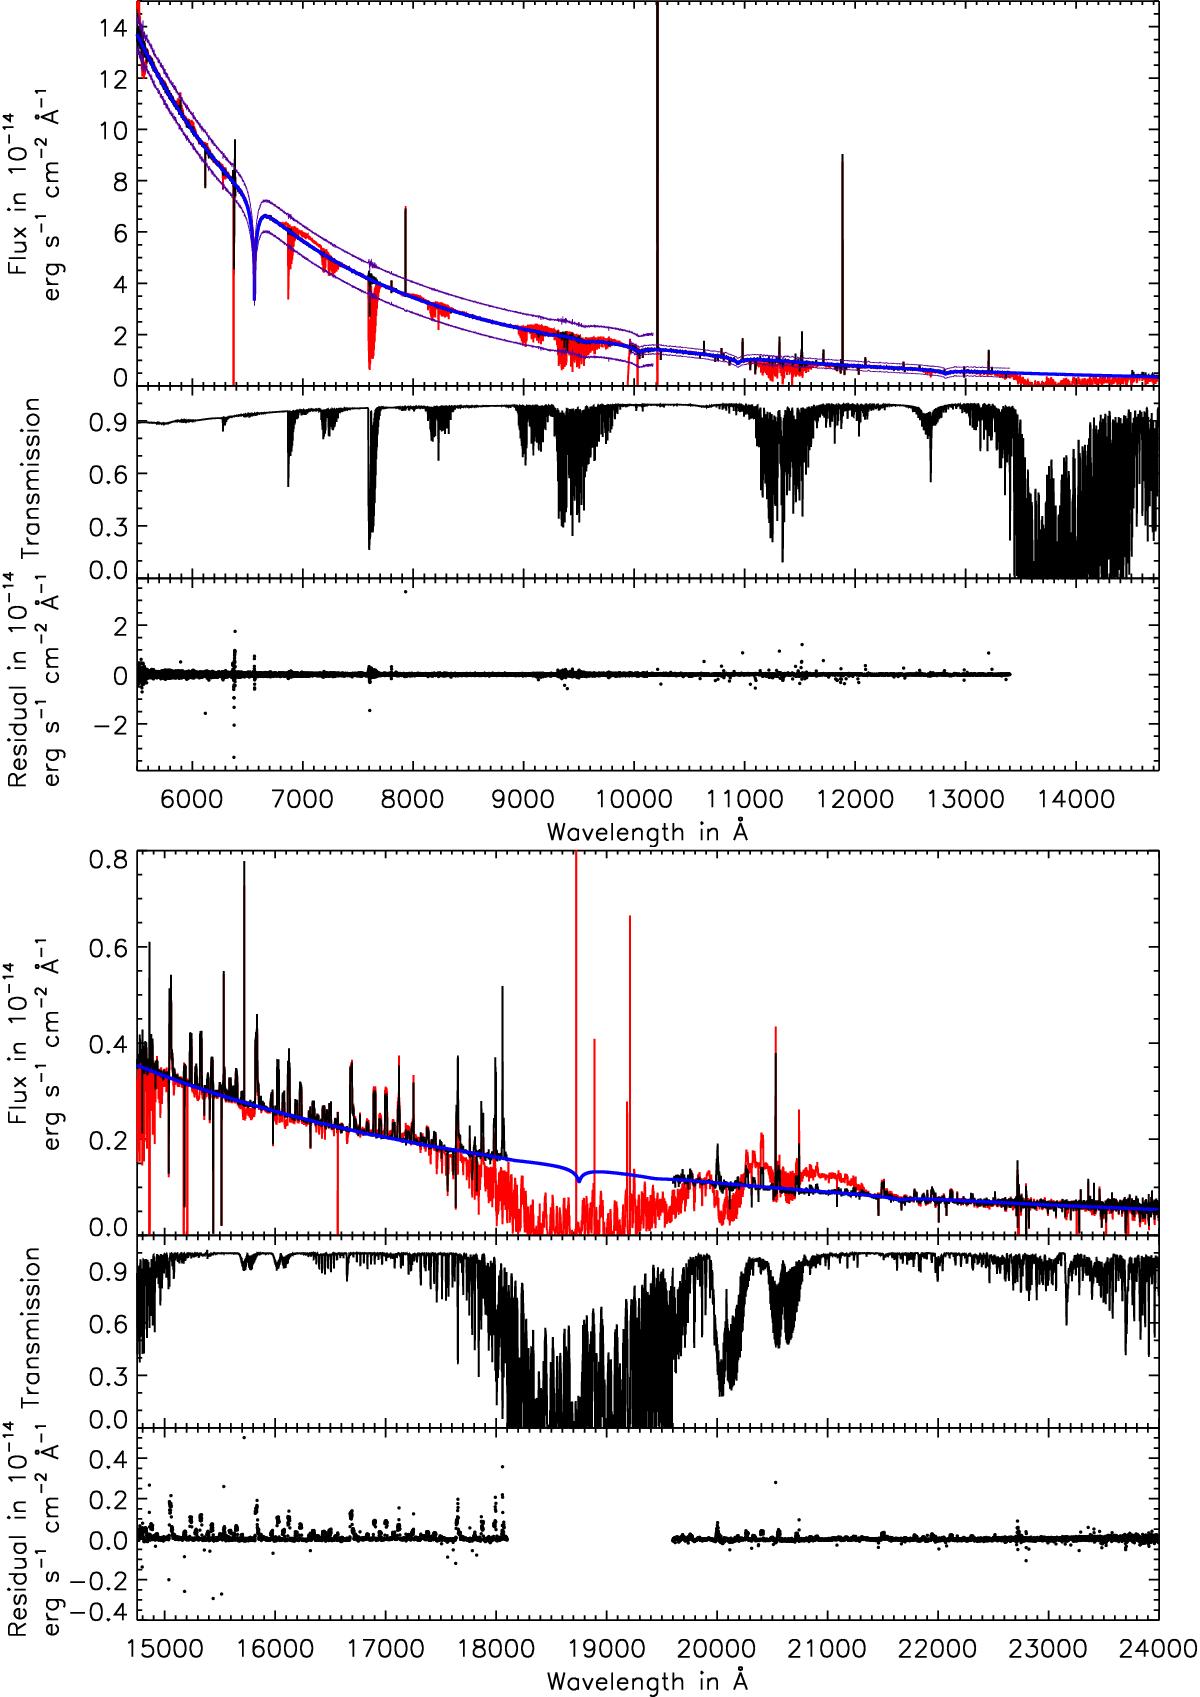
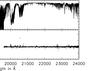
Telluric line corrected spectrum of the flux standard white dwarf EG 274 (black), pipeline flux-calibrated spectrum (red) for comparison, catalogued flux (blue), and limits to identify detector artefacts (thin purple) in the upper panel, the telluric transmission model in the middle panel, and the residuals (telluric corrected minus catalogued flux) in the bottom panel of the plots. Residuals are typically a small percentage of the actual flux value. Typical statistical uncertainties of the residuals are smaller than the plot symbols. We do not include the uncertainty of the absolute flux calibration here. Extreme residuals due to detector artefacts fall outside the displayed range. See text for further comments on the construction of this figure.
Current usage metrics show cumulative count of Article Views (full-text article views including HTML views, PDF and ePub downloads, according to the available data) and Abstracts Views on Vision4Press platform.
Data correspond to usage on the plateform after 2015. The current usage metrics is available 48-96 hours after online publication and is updated daily on week days.
Initial download of the metrics may take a while.