Fig. 2
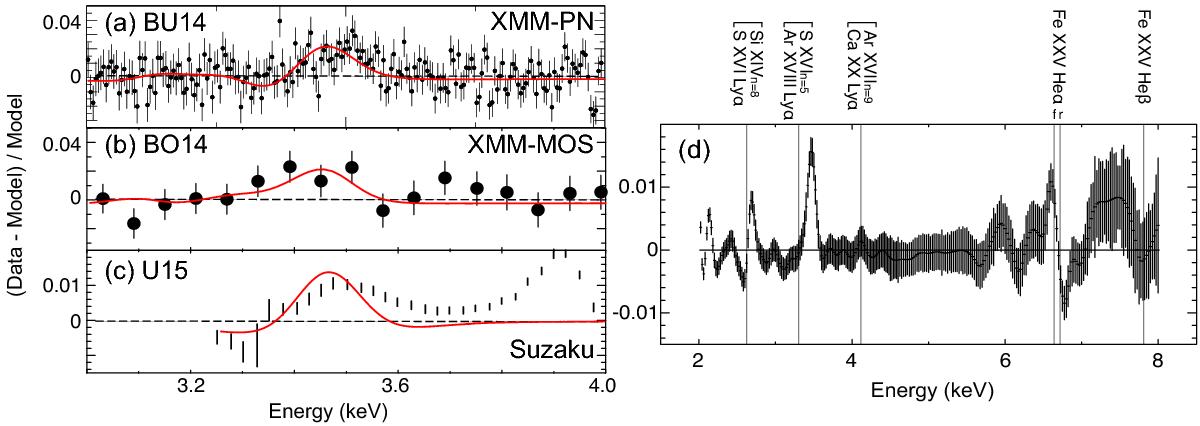
a)–c) The spectral fitting residuals reported in BU14 (top right panel of their Fig. 5), BO14 (right panel of their Fig. 6), and U15 (left panel of their Fig. 2), together with the expected residuals, shown as red curves, from our scenario described in Sect. 3.2. Emission measure of the CX model in c) is half of those in a) and b). As described in Sect. 3.2, the data-to-model deviation at ~3.9 keV in c) might be caused by other plasma emission lines. d) Fitting residual from a 1 Ms simulation of the XMM-Newton PN observation of the Perseus cluster. Details are described in Sect. 3.3. Vertical lines indicate the typical blended CIE and CX lines and the Fe xxv transitions in the 6.6–7.9 keV.
Current usage metrics show cumulative count of Article Views (full-text article views including HTML views, PDF and ePub downloads, according to the available data) and Abstracts Views on Vision4Press platform.
Data correspond to usage on the plateform after 2015. The current usage metrics is available 48-96 hours after online publication and is updated daily on week days.
Initial download of the metrics may take a while.