Fig. 1
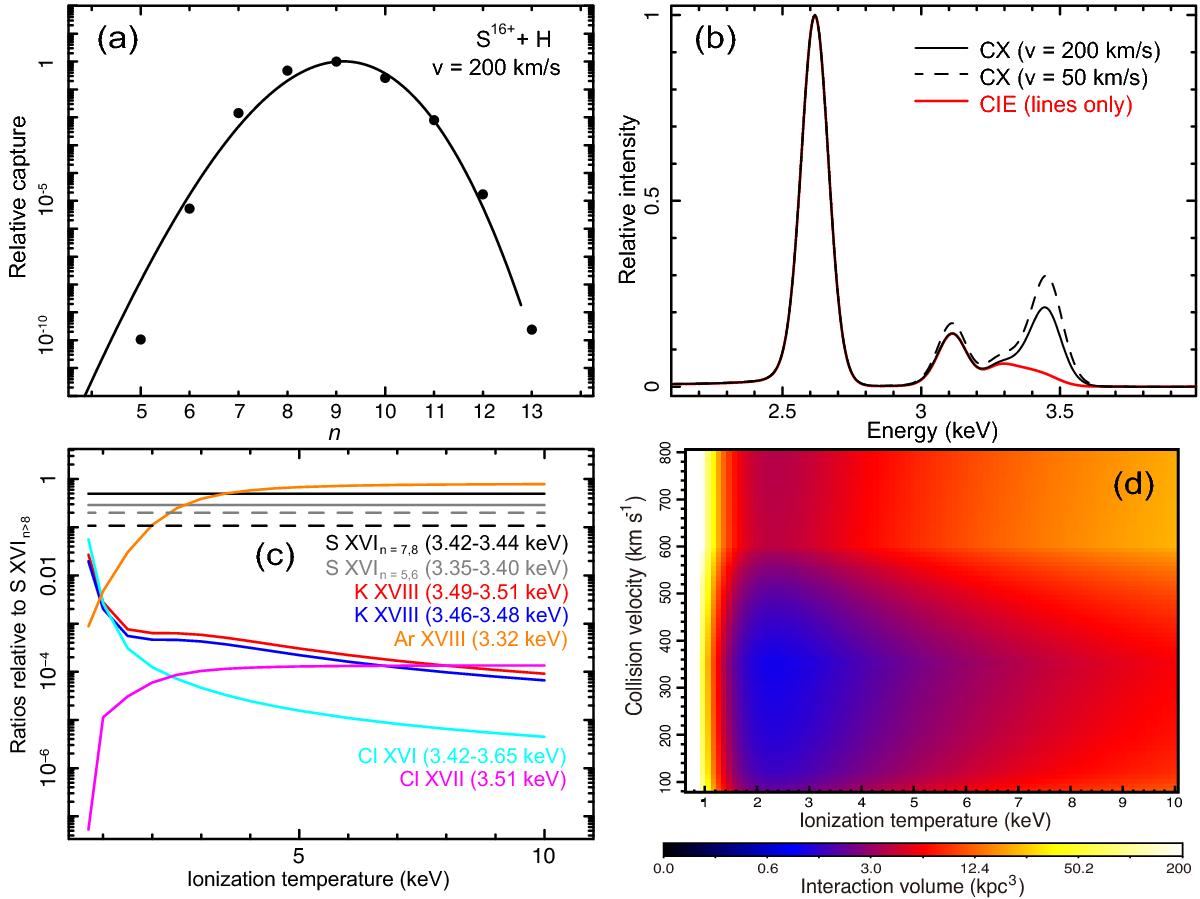
a) Fractions of electron captured into n shells at v = 200 km s-1 for S16+ + H. The solid line is the scaling relation obtained in Gu et al. (2015), and the data points come from actual calculation by Cumbee et al. (in prep.). b) S xvi line emission, normalized to the Lyα transition for CX (black) and CIE (red) models. The CX spectra with v = 200 keV-1 and 50 keV-1 are shown in solid and dashed lines, respectively. The ionization temperatures are set to 3 keV in all cases, and the spectra are folded with the XMM-Newton PN response. c) All the CX lines in the 3.3–3.7 keV band, normalized to the S xvi transitions from n> 8 to the ground at 3.45–3.47 keV, and plotted as a function of ionization temperature. The solid lines are obtained by setting v = 200 keV-1, while for S xvi transitions, we also plot, in dashed lines, the results with v = 50 keV-1. d) A 2D color map of interaction volume V, on the plane of ionization temperature and collision velocity, to reproduce the reported ULF flux (Sect. 3.2).
Current usage metrics show cumulative count of Article Views (full-text article views including HTML views, PDF and ePub downloads, according to the available data) and Abstracts Views on Vision4Press platform.
Data correspond to usage on the plateform after 2015. The current usage metrics is available 48-96 hours after online publication and is updated daily on week days.
Initial download of the metrics may take a while.