Fig. 3
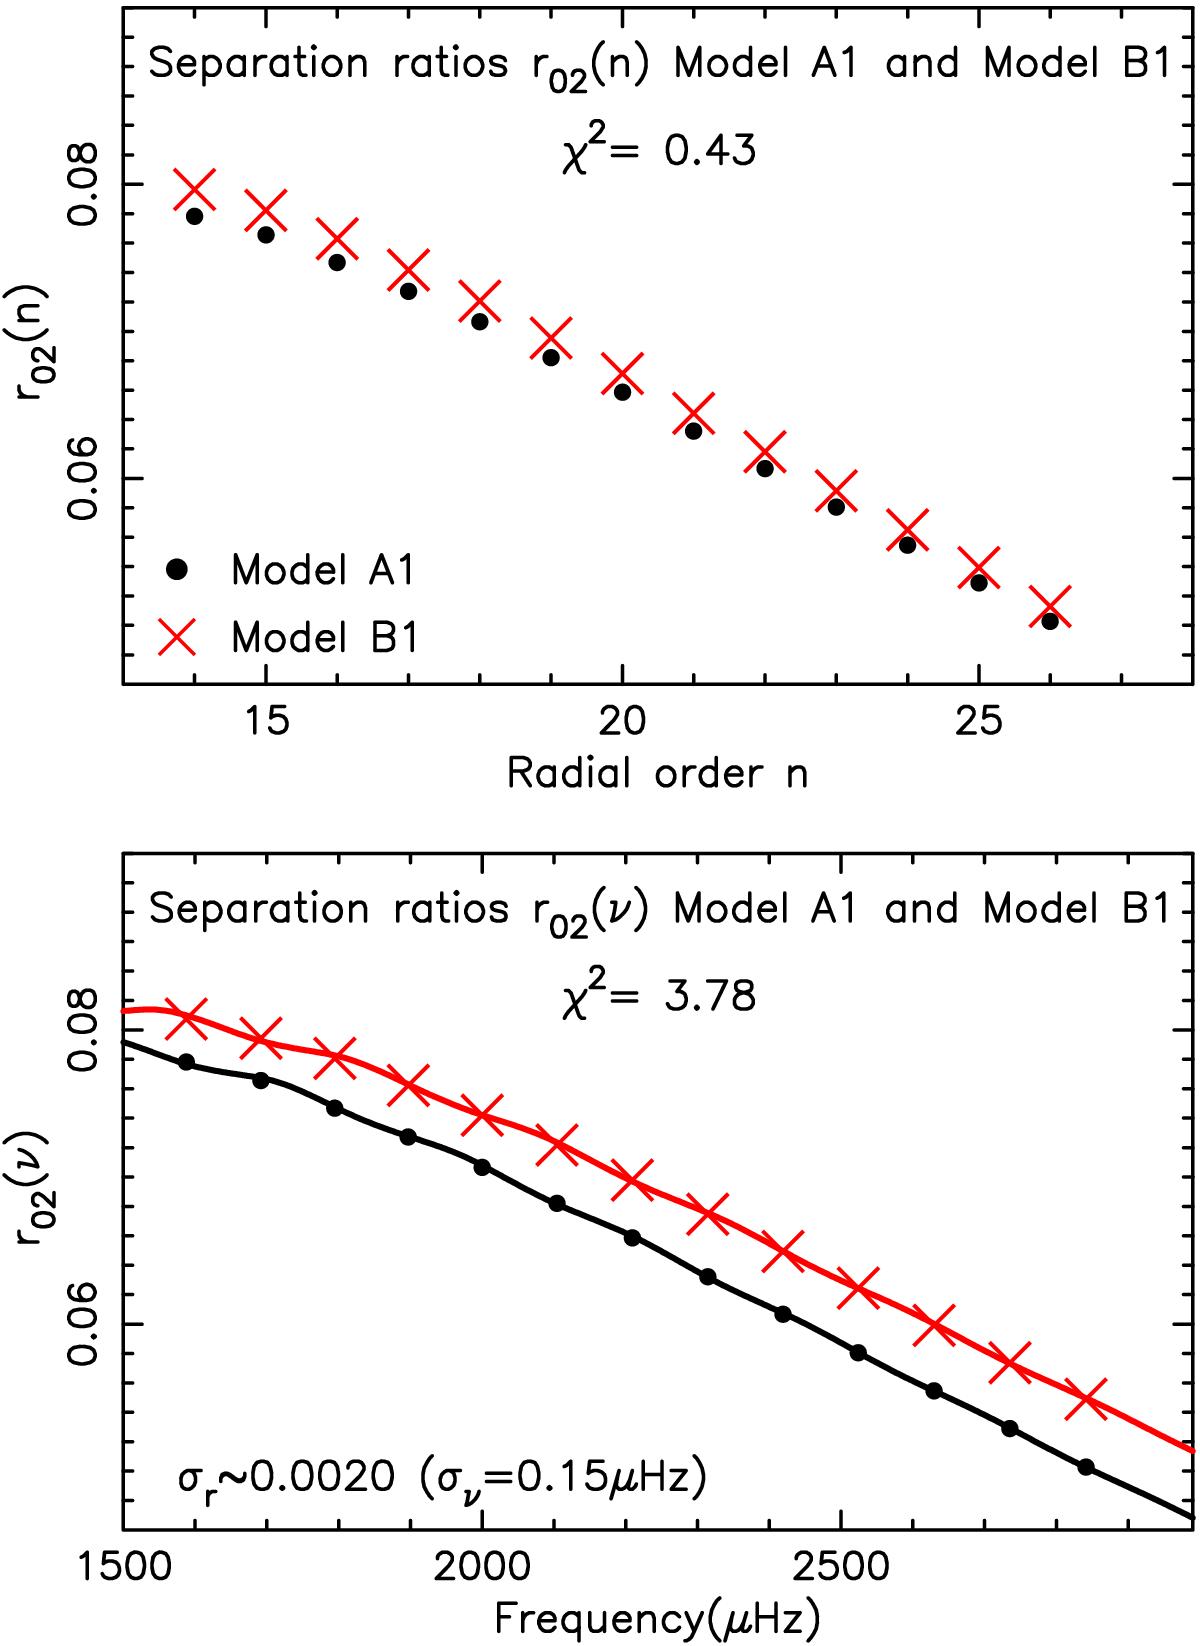
Comparison of separation ratios r02 of Model A1 and B1. Top panel: comparison at the same n where the fit is good with a χ2 = 0.43; bottom panel: fit at the same frequencies which is equivalent to comparing inner phase shift differences which would agree were the two models to have the same interior structure. The continuous curves are the inner phase shift differences δ2(ν) − δ0(ν) for the 2 models.
Current usage metrics show cumulative count of Article Views (full-text article views including HTML views, PDF and ePub downloads, according to the available data) and Abstracts Views on Vision4Press platform.
Data correspond to usage on the plateform after 2015. The current usage metrics is available 48-96 hours after online publication and is updated daily on week days.
Initial download of the metrics may take a while.