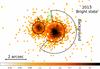
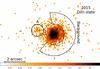
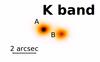
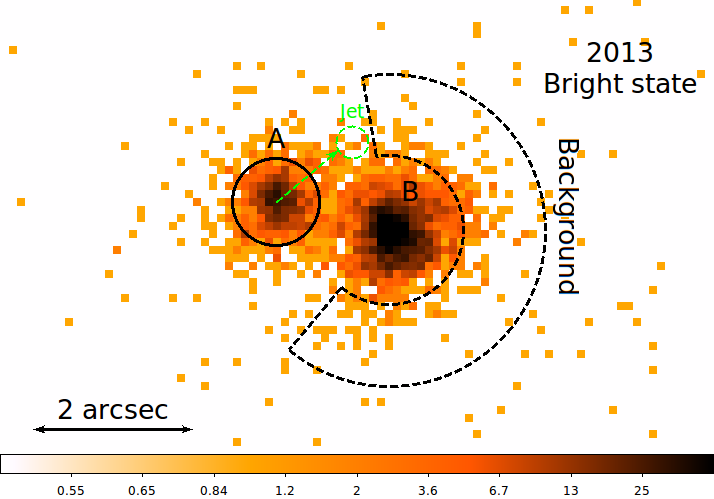
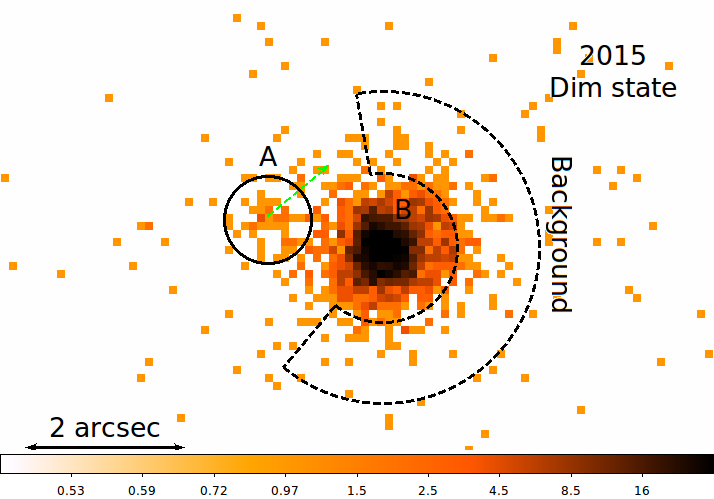
Fig. 1

X-ray images of RW Aur taken during the bright state in 2013 (top) and during the dim state in 2015 (bottom); the color bars indicate counts per pixel. The scaling reflects the difference in exposure time, i.e., similar count rates have similar colors. The inset shows the same sky area in the K-band obtained two days after the X-ray observation.
Current usage metrics show cumulative count of Article Views (full-text article views including HTML views, PDF and ePub downloads, according to the available data) and Abstracts Views on Vision4Press platform.
Data correspond to usage on the plateform after 2015. The current usage metrics is available 48-96 hours after online publication and is updated daily on week days.
Initial download of the metrics may take a while.