Free Access
Fig. 4
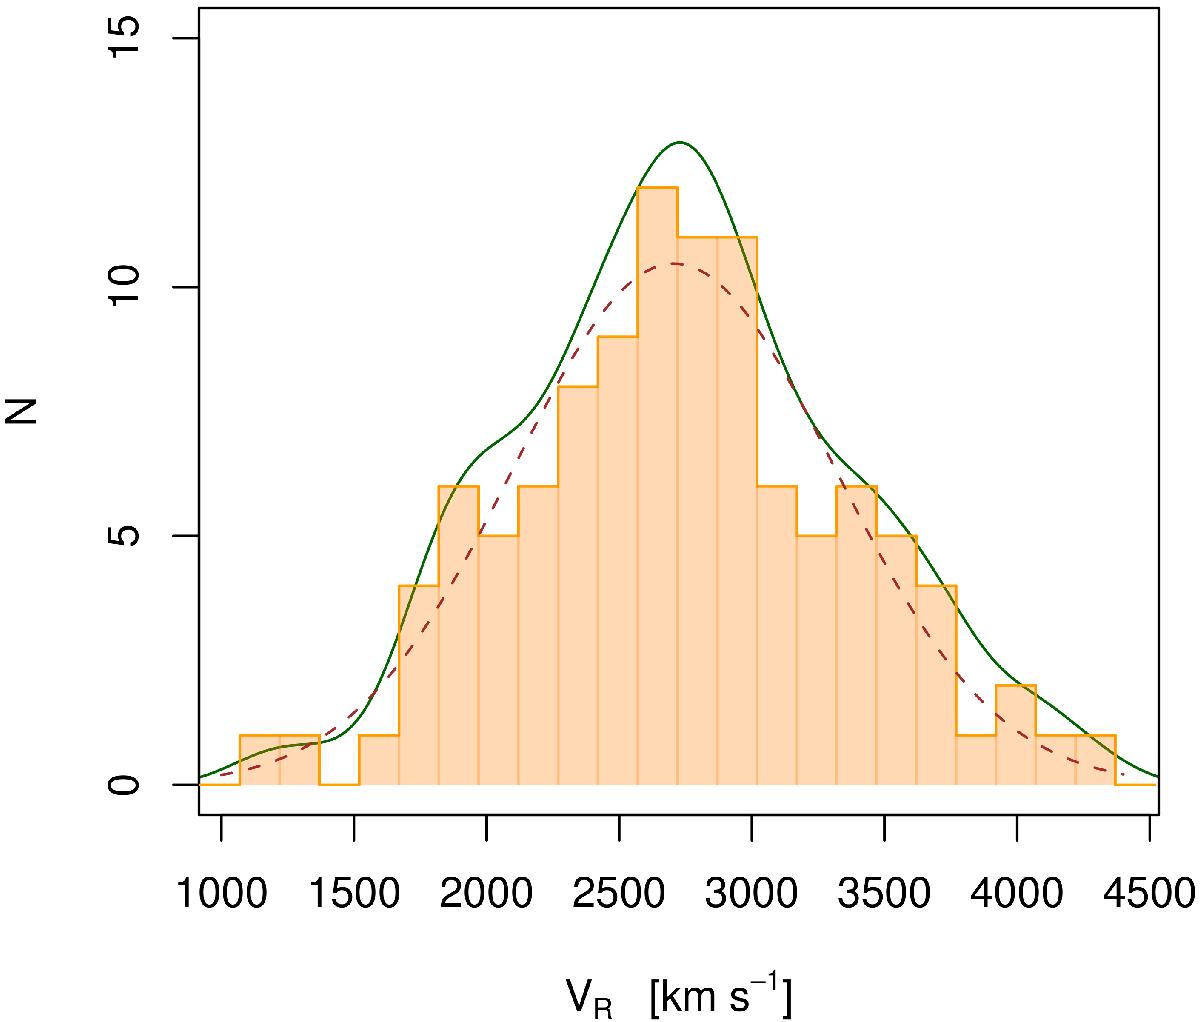
Histogram of the VR,h distribution for the galaxies in our Antlia sample. The bin width is 150 km s-1. Overplotted are the smooth velocity distribution, obtained with a Gaussian kernel (green solid curve), and the normal profile fitted by least squares (brown dashed curve).
Current usage metrics show cumulative count of Article Views (full-text article views including HTML views, PDF and ePub downloads, according to the available data) and Abstracts Views on Vision4Press platform.
Data correspond to usage on the plateform after 2015. The current usage metrics is available 48-96 hours after online publication and is updated daily on week days.
Initial download of the metrics may take a while.