Fig. 8
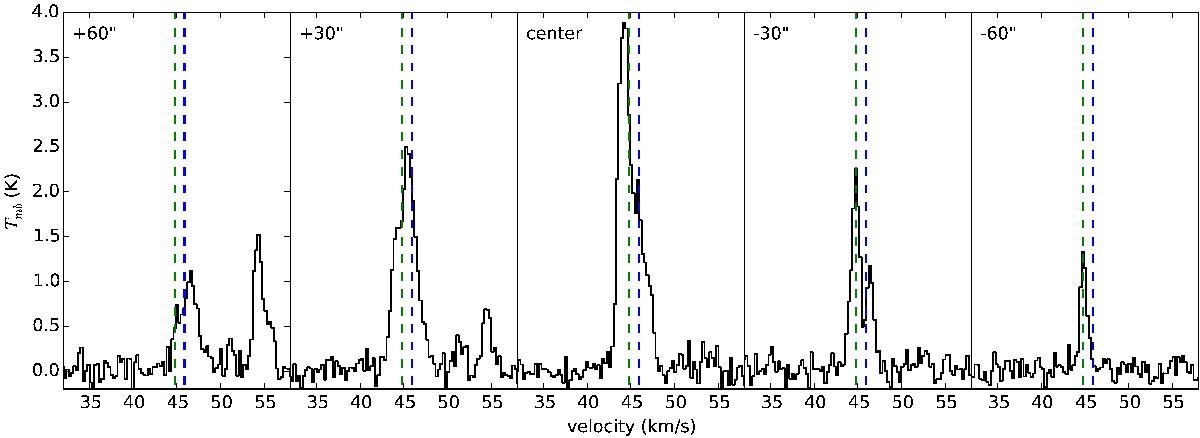
C18O(2–1) spectra from the IRAM 30 m telescope extracted along a cut perpendicular to the filament at a declination of mm continuum source 8 (Beuther et al. 2014; Ragan et al., in prep.). The green and blue vertical lines indicate the two velocity components measured in N2H+(1–0) toward the central source 8. The RA offsets are labelled in each panel.
Current usage metrics show cumulative count of Article Views (full-text article views including HTML views, PDF and ePub downloads, according to the available data) and Abstracts Views on Vision4Press platform.
Data correspond to usage on the plateform after 2015. The current usage metrics is available 48-96 hours after online publication and is updated daily on week days.
Initial download of the metrics may take a while.