Fig. 4
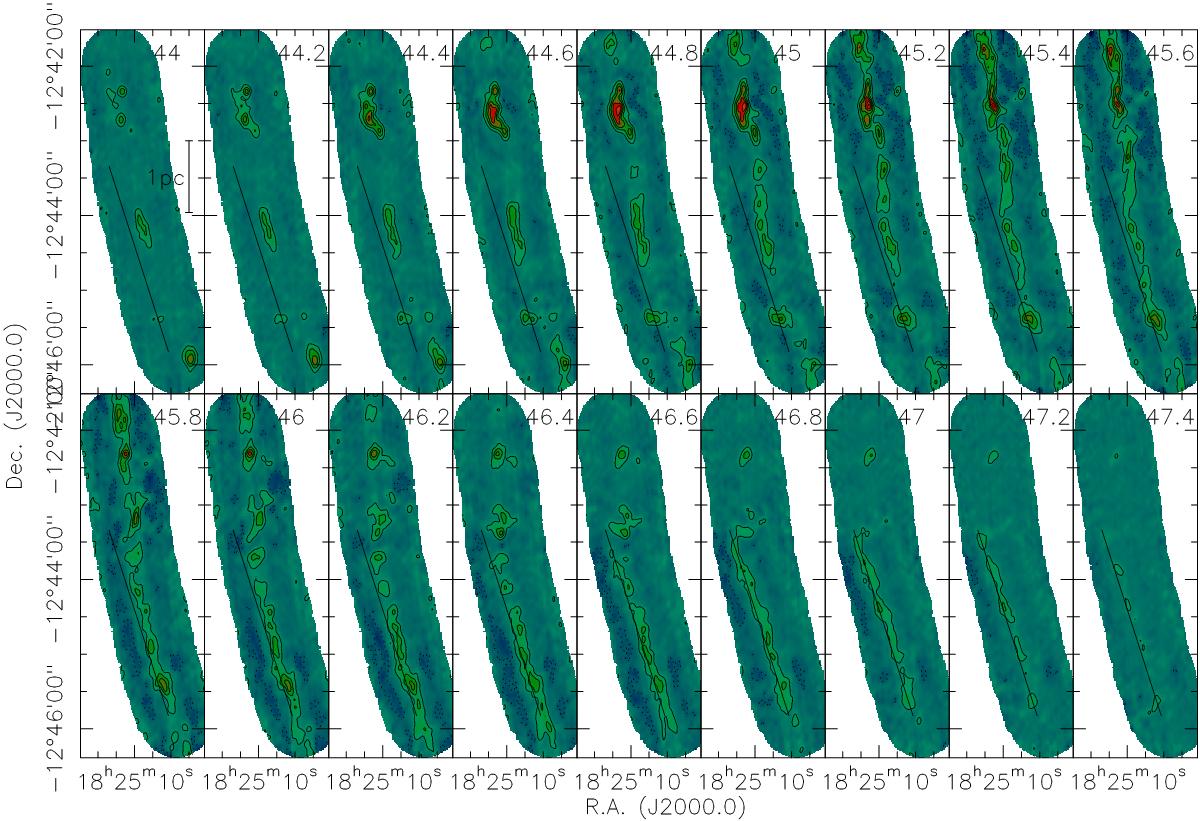
Channel map of the isolated component of the N2H+(1−0) line. The velocities are shifted by the separation of the hyperfine structure line of 8 km s-1 to the vlsr. Velocities for each channel are given in the top-right of each panel. The contours in each panel are from 5 to 95% of the respective peak emission in that channel. Negative features at the same contour levels are shown in dashed lines. A linear scale bar is presented in the top-left panel. The line is meant to guide the eye and is drawn along the main filamentary structure visible in the channel at 47.2 km s-1.
Current usage metrics show cumulative count of Article Views (full-text article views including HTML views, PDF and ePub downloads, according to the available data) and Abstracts Views on Vision4Press platform.
Data correspond to usage on the plateform after 2015. The current usage metrics is available 48-96 hours after online publication and is updated daily on week days.
Initial download of the metrics may take a while.