Fig. 3
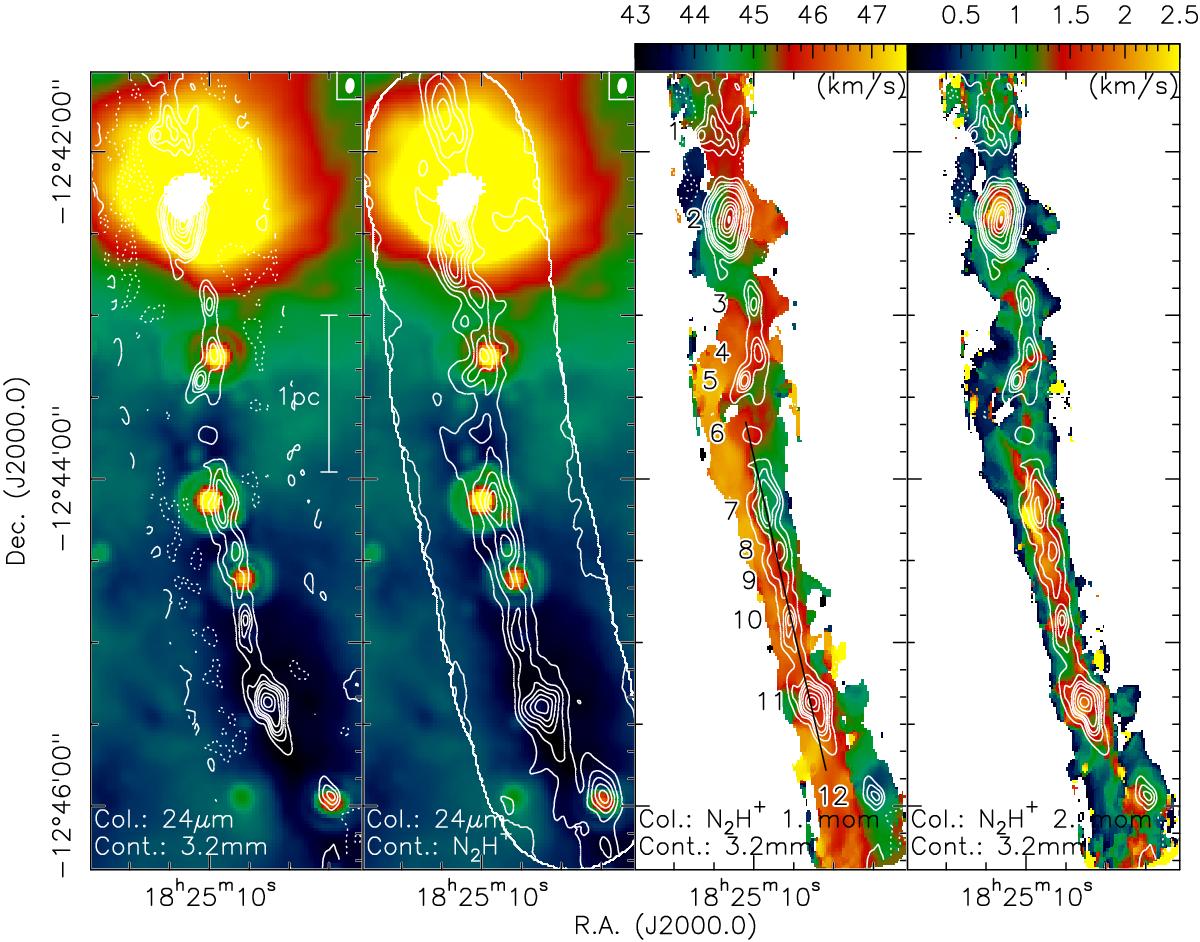
Continuum and line images of the IRDC 18223 filament. The left and 2nd panel show the Spitzer 24 μm emission in color with a stretch to increase the visibility of the mid-infrared dark filament. The left panel presents in contours the 3.2 mm continuum emission with natural weighting and the same levels as in Fig. 2. For comparison, the 2nd panel shows in contours the integrated N2H+(1−0) emission covering all hyperfine structure components between 35 and 55 km s-1. The third and 4th panel present the 1st and 2nd moment maps (intensity-weighted peak velocities and line-width) extracted from the isolated most negative hyperfine structure component. In the 3rd panel, the velocities are shifted by the separation of the hyperfine structure line of 8 km s-1 to the vlsr. The contours in the 3rd and 4th panel both show the same continuum contours as in the left panel. The black line in panel 3 gives the direction of the position-velocity cut shown in Fig. 6. A scale-bar is depicted in the left panel.
Current usage metrics show cumulative count of Article Views (full-text article views including HTML views, PDF and ePub downloads, according to the available data) and Abstracts Views on Vision4Press platform.
Data correspond to usage on the plateform after 2015. The current usage metrics is available 48-96 hours after online publication and is updated daily on week days.
Initial download of the metrics may take a while.