Fig. 1
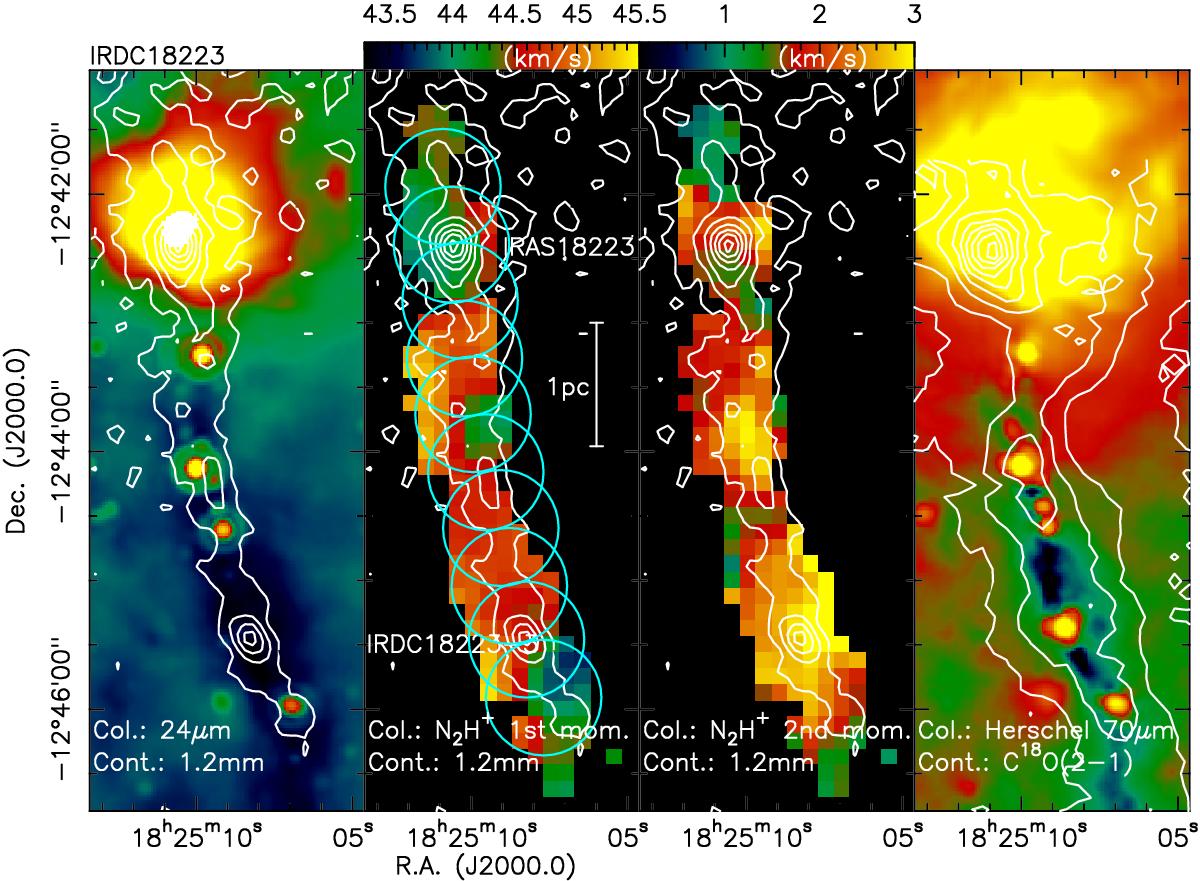
Filamentary cloud IRDC 18223: left panel presents the Spitzer 24 μm image in color (Beuther & Steinacker 2007) and the MAMBO 1.2 mm continuum map in contours (Beuther et al. 2002) with levels from 5 to 95% of the peak emission of 753 mJy beam-1 (in 10% steps). The 2nd and 3rd panels present the Nobeyama 45 m N2H+(1–0) 1st- and 2nd-moment maps, respectively (Tackenberg et al. 2014). Right panel shows the Herschel 70 μm observations (in color) and in contours the IRAM 30 m C18O(2–1) data integrated from 40 to 49 km s-1. The contours are from 5 to 95% of the peak emission of 18.6 K km s-1 (in 10% steps). Additionally, the second panel shows the two main sources (the HMPO IRAS 18223-1243 in the north and IRDC 18223-3 in the south), a scale bar, as well as the positions of the 10 observed mosaic fields.
Current usage metrics show cumulative count of Article Views (full-text article views including HTML views, PDF and ePub downloads, according to the available data) and Abstracts Views on Vision4Press platform.
Data correspond to usage on the plateform after 2015. The current usage metrics is available 48-96 hours after online publication and is updated daily on week days.
Initial download of the metrics may take a while.