Fig. 8
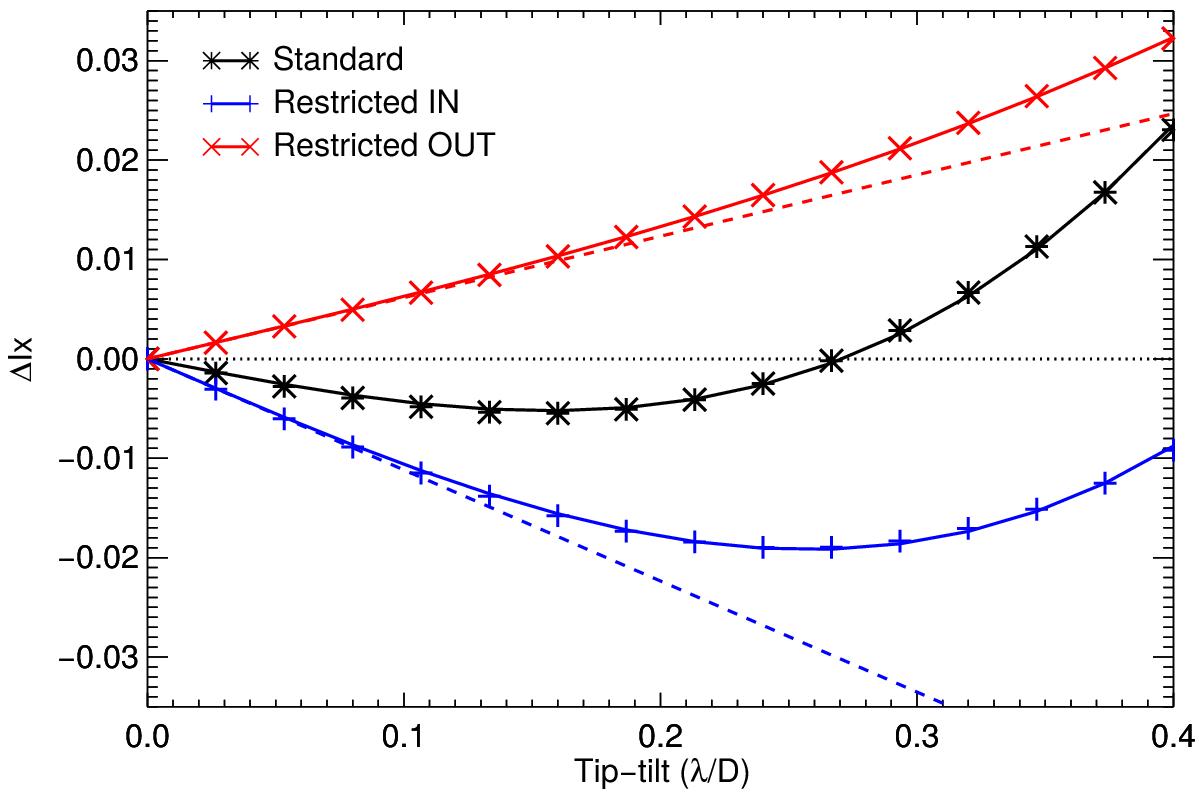
Estimated differential intensities resulting from simulated images in the case of a pupil centrally obstructed (24% of the full diameter). The solid line curves show the best-fit model in the least-squares sense (the model consists of a linear and a cubic component), while the dashed lines only show the linear contribution. The three cases differ in the area used to compute the differential intensity: standard whole area (in black), inner (<2λ/D, in blue), or outer area (>2λ/D, in red). The outer diameter of the Lyot stop is downsized by a factor of 80%, while the central obstruction diameter is set to 35% (1.45 oversizing factor).
Current usage metrics show cumulative count of Article Views (full-text article views including HTML views, PDF and ePub downloads, according to the available data) and Abstracts Views on Vision4Press platform.
Data correspond to usage on the plateform after 2015. The current usage metrics is available 48-96 hours after online publication and is updated daily on week days.
Initial download of the metrics may take a while.