Fig. 4
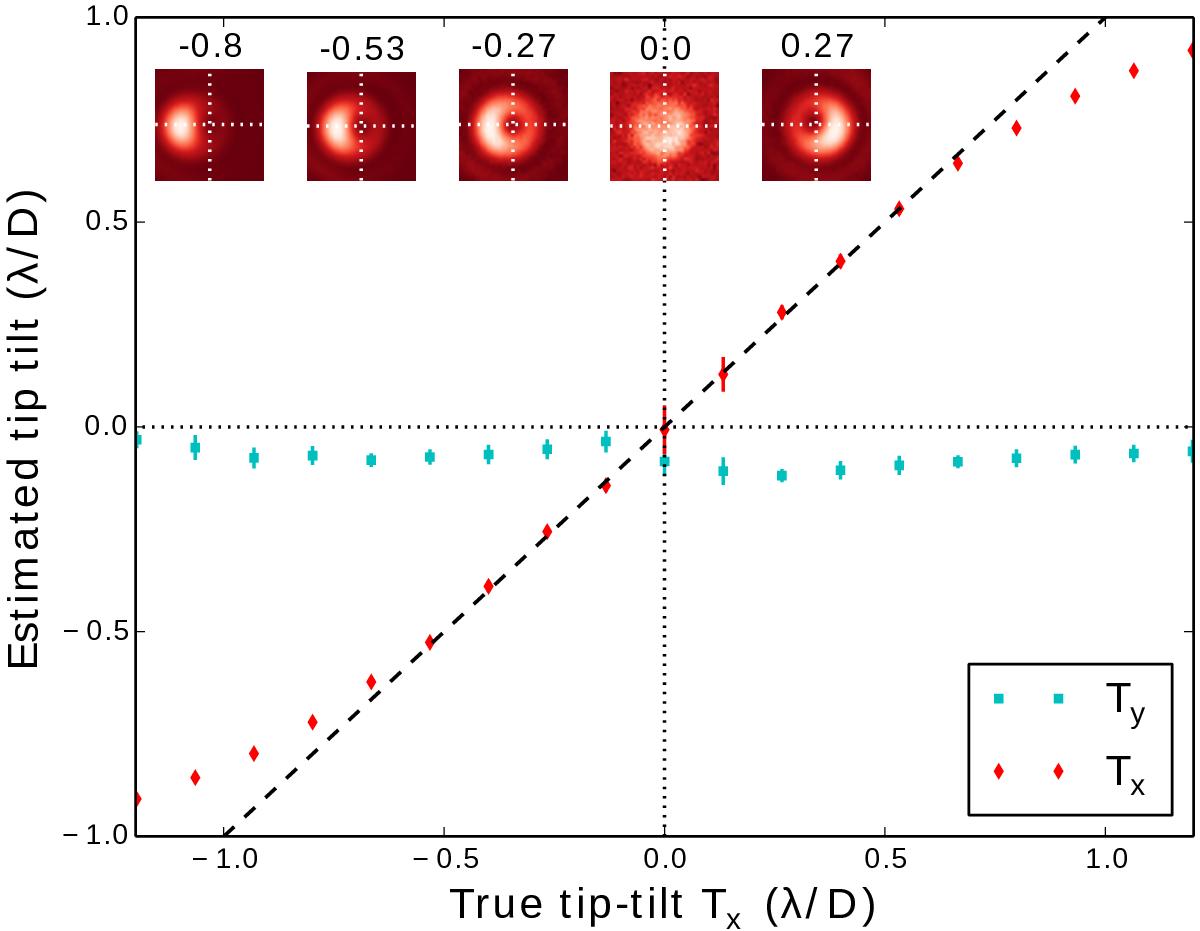
Experimental results for the estimation of the tip-tilt aberration in one direction (the AGPM has only been translated along the x axis). Error bars are computed from the standard deviation of 50 values estimated from a sequence of 50 images. The images on the top left corner of the graph show the mean images of several sequences acquired for different values of tip-tilt, which are provided on top of each image in λ/D.
Current usage metrics show cumulative count of Article Views (full-text article views including HTML views, PDF and ePub downloads, according to the available data) and Abstracts Views on Vision4Press platform.
Data correspond to usage on the plateform after 2015. The current usage metrics is available 48-96 hours after online publication and is updated daily on week days.
Initial download of the metrics may take a while.