Fig. B.2
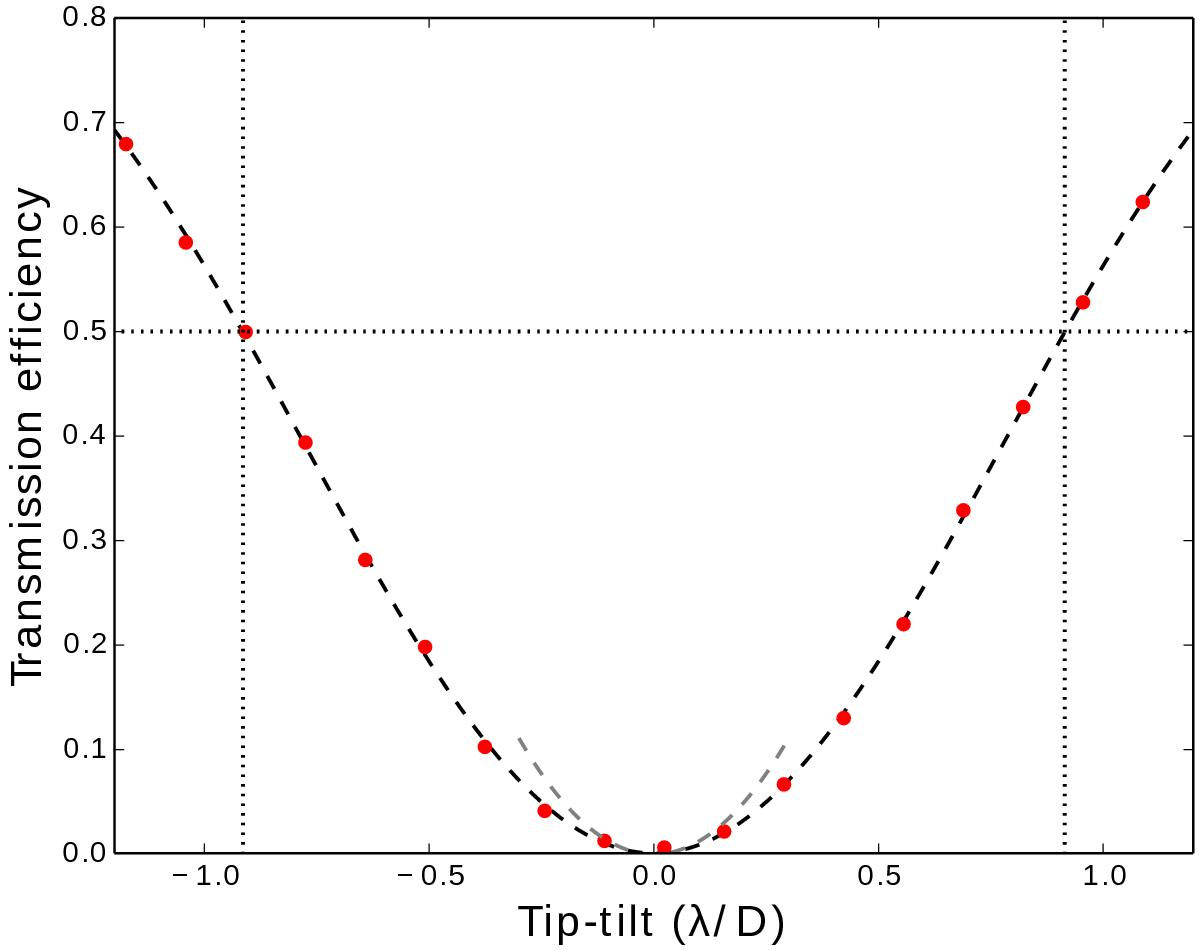
Measured transmission efficiency for an off-axis source through a VC. The red circles correspond to experimental results, while the dark dashed line is the best-fit model (polynomial function of even orders only, up to the 6th order). The light gray dashed line corresponds to the theoretical model as stated by Eq. (B.2), assuming very small tip-tilt (it is thus drawn only for absolute tip-tilt <0.3λ/D). The inner working angle is graphically represented by dotted lines, which highlight the transmission limit of 50%, reached for tip-tilt of 0.9 λ/D.
Current usage metrics show cumulative count of Article Views (full-text article views including HTML views, PDF and ePub downloads, according to the available data) and Abstracts Views on Vision4Press platform.
Data correspond to usage on the plateform after 2015. The current usage metrics is available 48-96 hours after online publication and is updated daily on week days.
Initial download of the metrics may take a while.