Free Access
Fig. 11
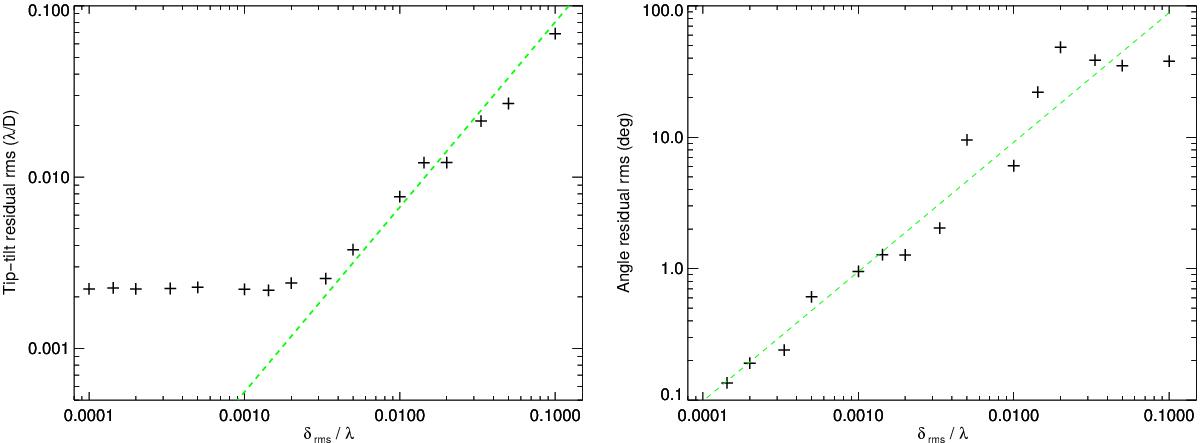
Root mean square values for the residual tip-tilt amplitude (left) and orientation angle (right), as a function of the wavefront error. For the amplitude, the rms is computed over the reduced [0,0.2]λ/D range, where the linear model approximation is valid. The green dashed lines correspond to a best-fit power law model.
This figure is made of several images, please see below:
Current usage metrics show cumulative count of Article Views (full-text article views including HTML views, PDF and ePub downloads, according to the available data) and Abstracts Views on Vision4Press platform.
Data correspond to usage on the plateform after 2015. The current usage metrics is available 48-96 hours after online publication and is updated daily on week days.
Initial download of the metrics may take a while.