Fig. 8
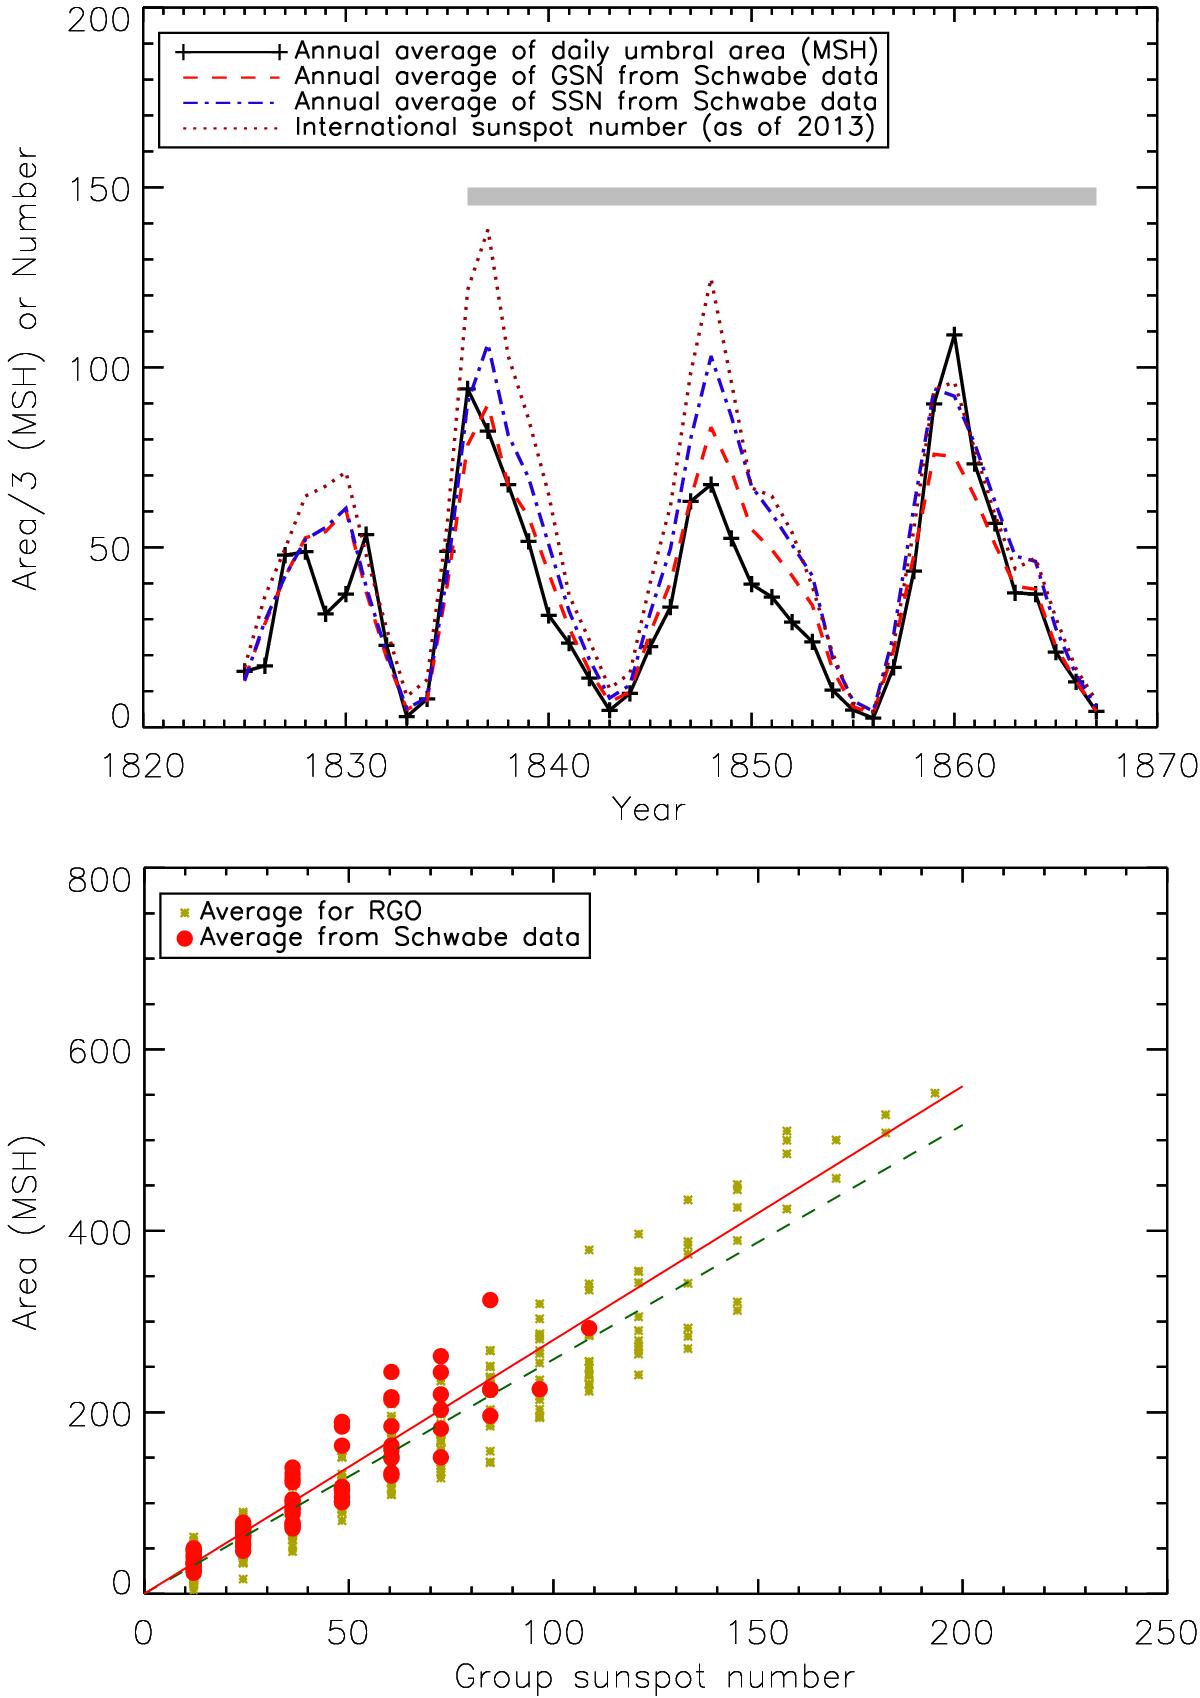
Top: annual averages of total-disk umbral area of sunspots in MSH and divided by three (solid line), the group sunspot number (GSN) derived from our groupings (dashed line), the sunspot number (SSN; Wolf number) derived from our groupings and the actual number of spots in the full-disk drawings (dash-dotted line), and the official International Sunspot Number (dotted line) of before the revision suggested by Clette et al. (2014) which was not yet available. The grey horizontal bar indicates the period in which the number of spots per group was fairly constant (cf. Fig. 7). Bottom: daily total umbral areas versus GSN (in case of Schwabe, the GSN is based on our grouping in Schwabe’s drawings, corresponding to the dashed line in the top panel), averaged over 100 values in each group sunspot number bin for the Schwabe data (circles) and the Greenwich data (asterisks). The solid and dashed lines are linear fits through the Schwabe and Greenwich data, respectively, which must go through the origin.
Current usage metrics show cumulative count of Article Views (full-text article views including HTML views, PDF and ePub downloads, according to the available data) and Abstracts Views on Vision4Press platform.
Data correspond to usage on the plateform after 2015. The current usage metrics is available 48-96 hours after online publication and is updated daily on week days.
Initial download of the metrics may take a while.