Fig. 7
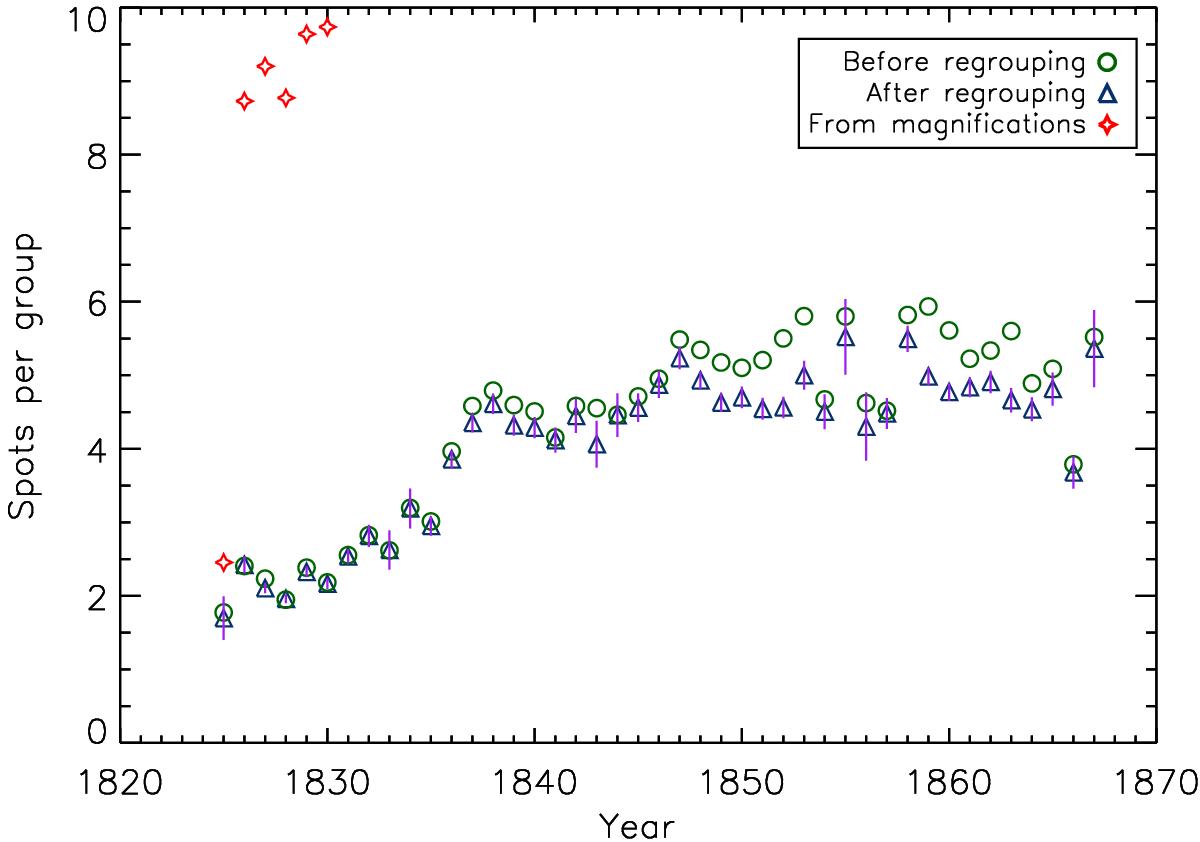
Annual averages of the number of spots per group calculated before the regrouping of sunspot groups (circles), after regrouping (triangles), and manually counted number of spots from the magnification drawings of sunspot groups (diamonds). Uncertainties are only given for the values after regrouping and are obtained from the relative Poissonian error 1/![]() , where ncounts are the number of all instances of all groups in a given year (groups count several times with different numbers of spots).
, where ncounts are the number of all instances of all groups in a given year (groups count several times with different numbers of spots).
Current usage metrics show cumulative count of Article Views (full-text article views including HTML views, PDF and ePub downloads, according to the available data) and Abstracts Views on Vision4Press platform.
Data correspond to usage on the plateform after 2015. The current usage metrics is available 48-96 hours after online publication and is updated daily on week days.
Initial download of the metrics may take a while.