Fig. 5
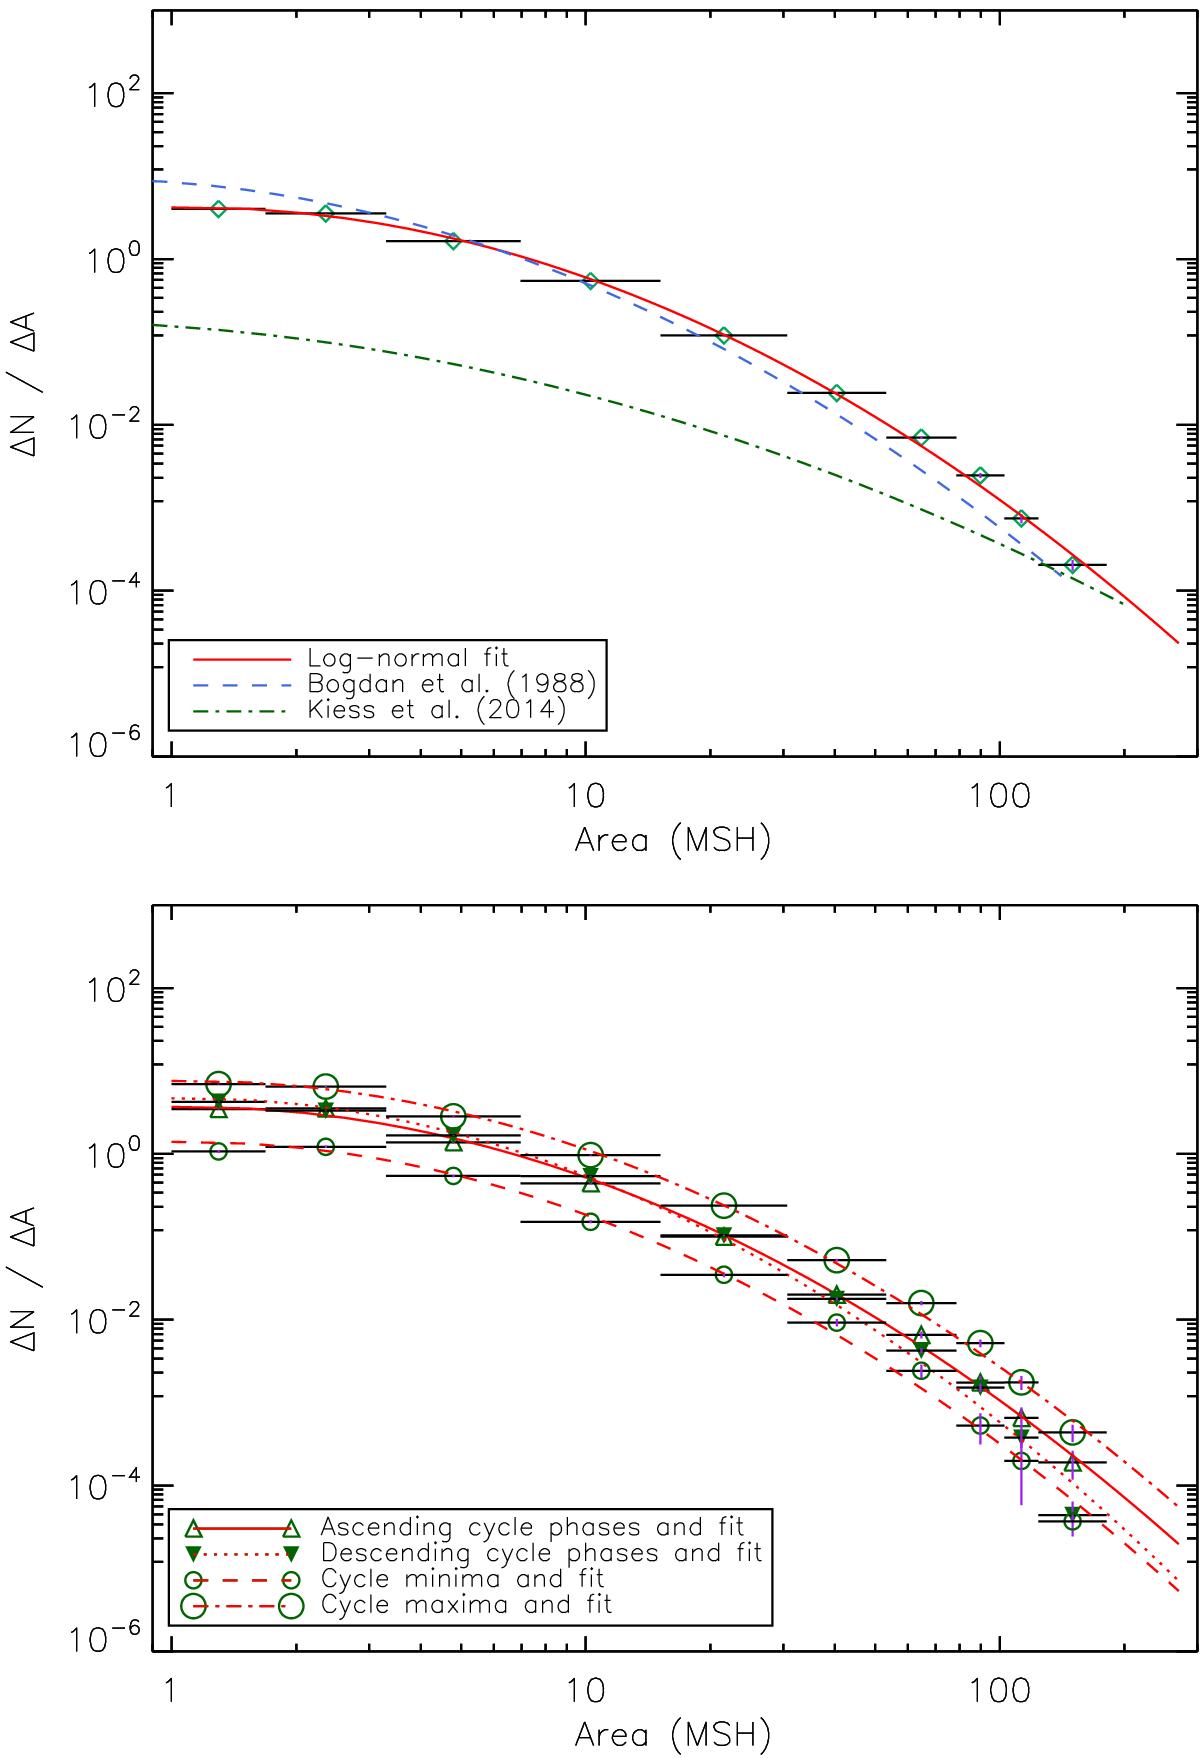
Distribution of estimated umbral areas of sunspots. Top: the area distribution for 1831−1867. The solid curve shows the log-normal fit. The dashed curve and dash dot curve are the fit curves form Bogdan et al. (1988) and Kiess et al. (2014), respectively. The horizontal bars show the widths of the bins. The error margins on the distribution values are all smaller than the symbols. Bottom: the area distribution of spots for ascending phases, descending phases, cycle minima and maxima of all cycles within 1831−1867. The lines show the log-normal fits for the corresponding area distributions.
Current usage metrics show cumulative count of Article Views (full-text article views including HTML views, PDF and ePub downloads, according to the available data) and Abstracts Views on Vision4Press platform.
Data correspond to usage on the plateform after 2015. The current usage metrics is available 48-96 hours after online publication and is updated daily on week days.
Initial download of the metrics may take a while.