Fig. 4
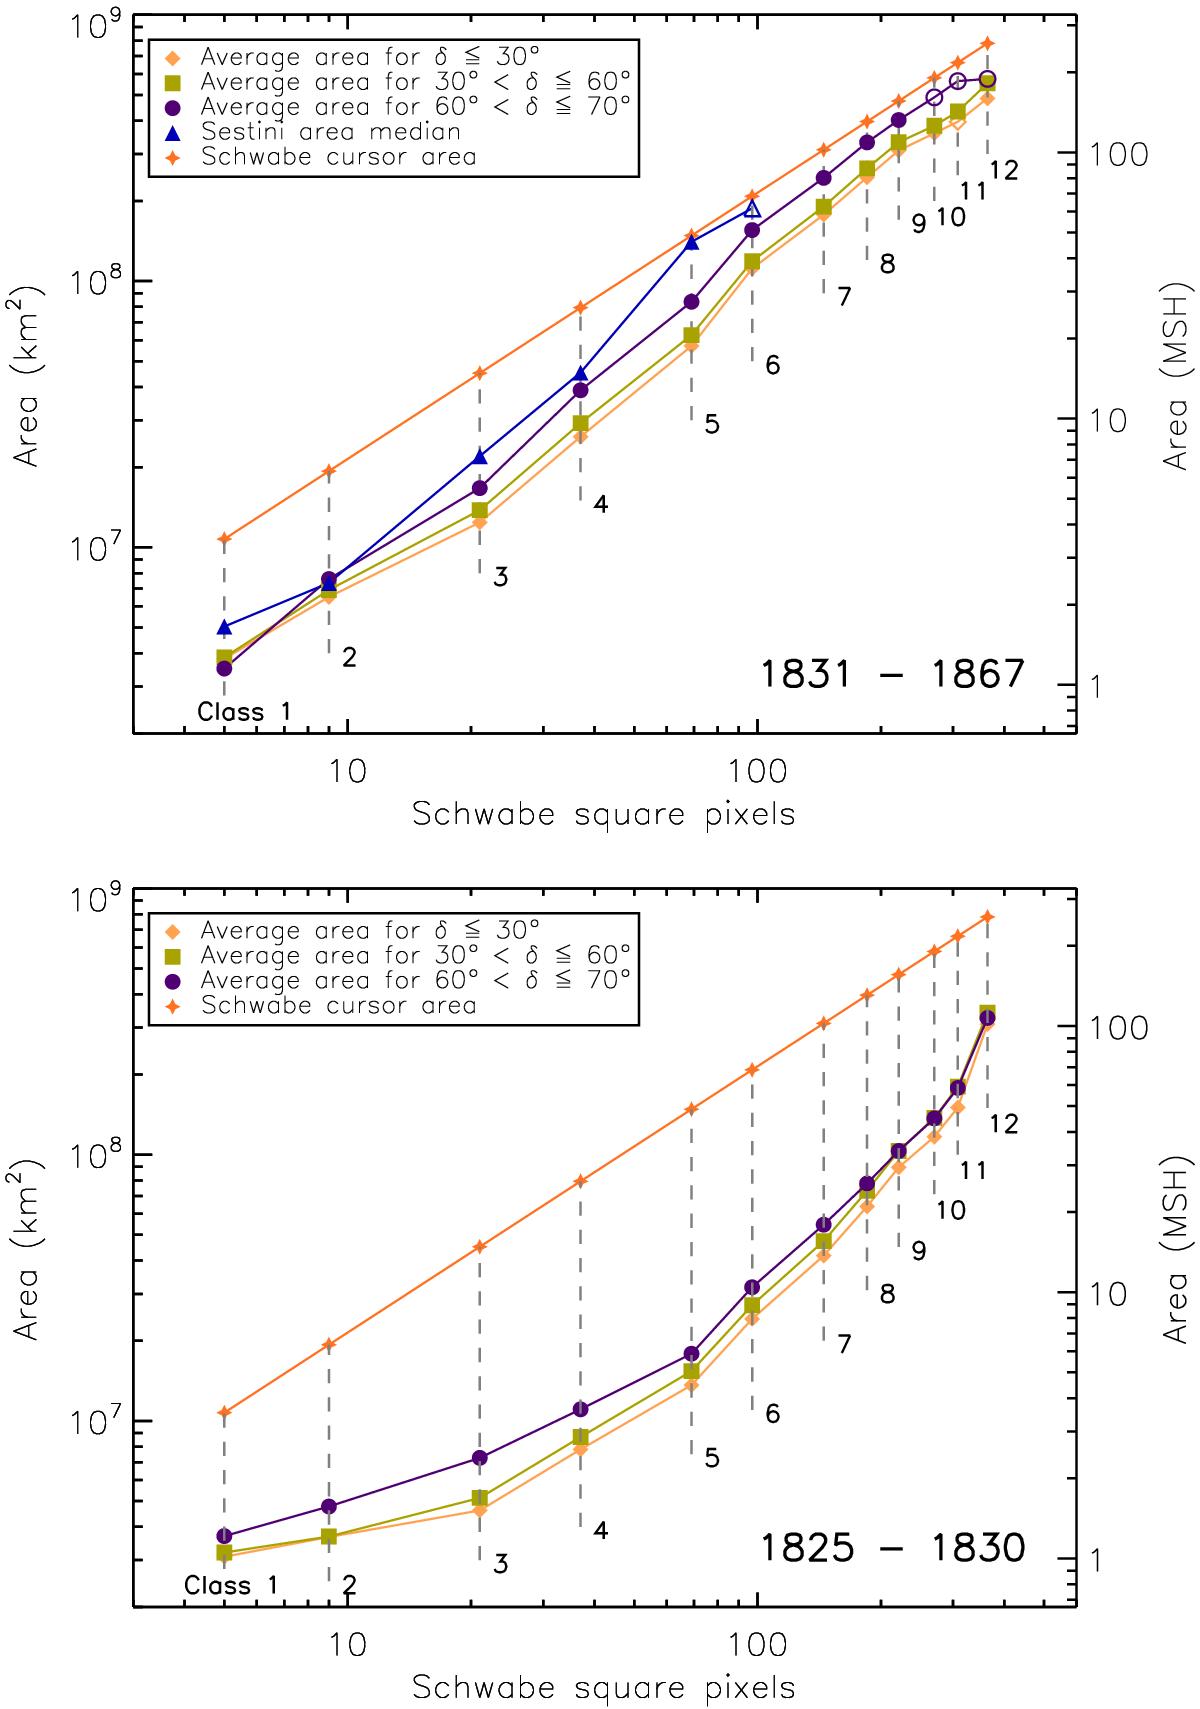
Average areas in km2 (left ordinate) and MSH (right ordinate) for each of the 12 size classes (abscissa), and for three different centre-distance ranges: <30° (diamonds), 30°−60° (squares), and 60°−70° (circles). The areas corresponding to the simple pixel areas of the size classes without any calibration are indicated with plus signs. The direct calibration of size classes by observations from Sestini in 1850 are shown as triangles. Top: average areas for the data from 1831−1867. Bottom: average areas for the data from 1825−1830. An open symbol means that the number of spots used in the calculation of the average area is less than 20. The lower curves in the bottom panel do not imply smaller areas, but they rather mean that any spot of a given true area was drawn as a spot of larger class in 1825−1830 than in 1831−1867.
Current usage metrics show cumulative count of Article Views (full-text article views including HTML views, PDF and ePub downloads, according to the available data) and Abstracts Views on Vision4Press platform.
Data correspond to usage on the plateform after 2015. The current usage metrics is available 48-96 hours after online publication and is updated daily on week days.
Initial download of the metrics may take a while.