Fig. 12
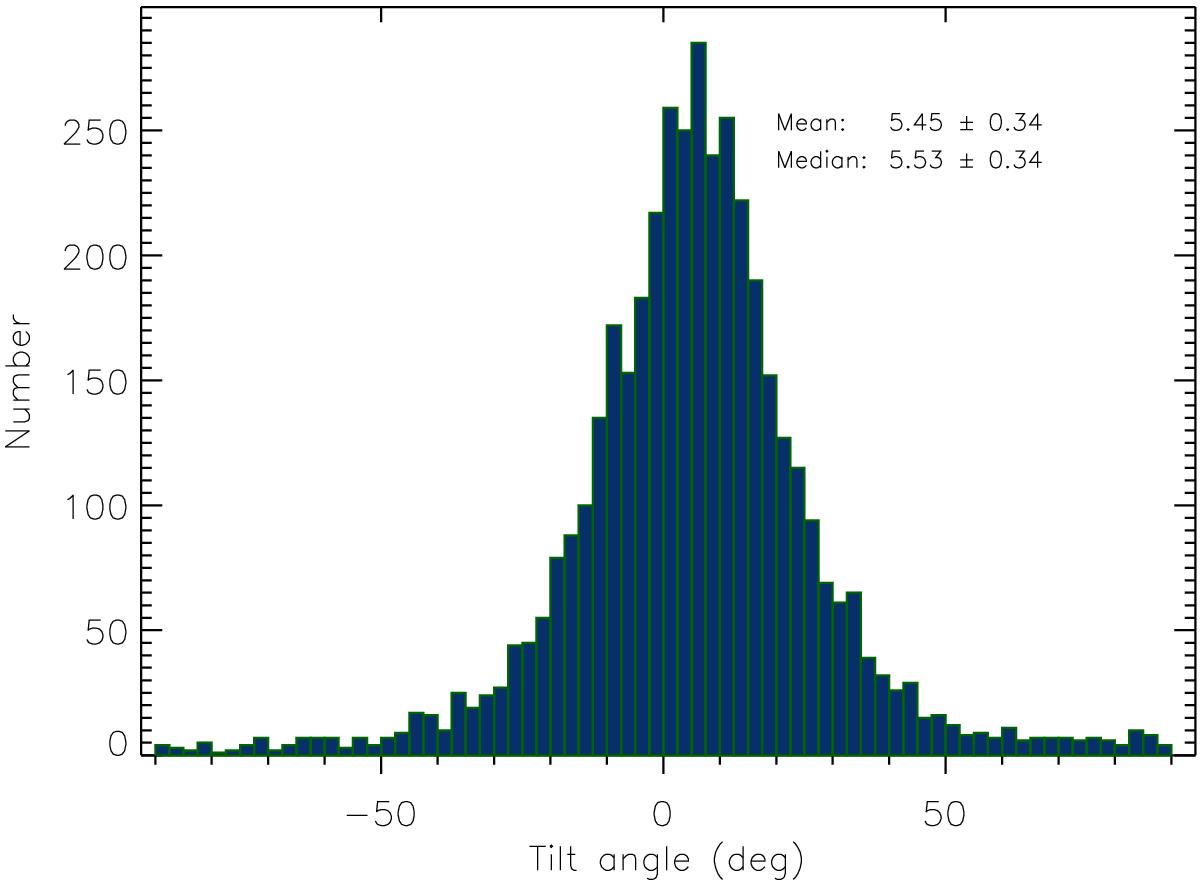
Tilt angle histogram of the Schwabe data for group centres within 60° central meridian distance and polarity separations Δβ> 3°. In this analysis, only spots with umbral areas of 5 MSH or more were used to compute the weighted positions of the polarities. The selection therefore affects both tilt angles and polarity separations. As compared with the hatched bars in Fig. 11, many groups have now turned into unipolar groups, since one of the polarities was represented by a single spot of less than 5 MSH.
Current usage metrics show cumulative count of Article Views (full-text article views including HTML views, PDF and ePub downloads, according to the available data) and Abstracts Views on Vision4Press platform.
Data correspond to usage on the plateform after 2015. The current usage metrics is available 48-96 hours after online publication and is updated daily on week days.
Initial download of the metrics may take a while.