Fig. 11
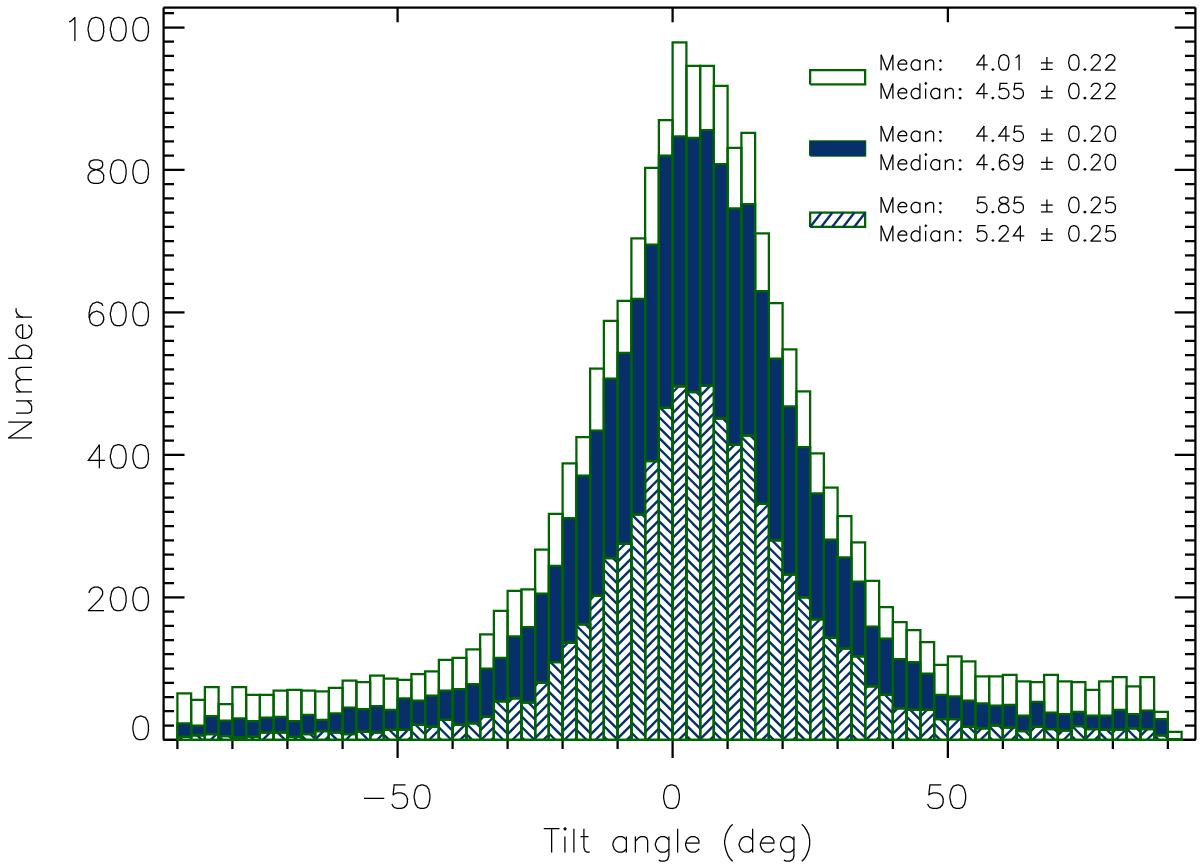
Histograms of the tilt angles of groups with area weighted centres within 60° central meridian distance. Open bars: entire set, filled bars: groups with a minimum polarity separation of Δβmin = 3°, and hatched bars: groups with Δβmin = 3° and a removal of evolutionary outliers that occur in the sequence of tilt angles during the evolution of any given group. This hatched histogram is an attempt to further reduce the influence of occasional unipolar instances of otherwise bipolar groups. See text for the detailed algorithm. The bin width is ![]() .
.
Current usage metrics show cumulative count of Article Views (full-text article views including HTML views, PDF and ePub downloads, according to the available data) and Abstracts Views on Vision4Press platform.
Data correspond to usage on the plateform after 2015. The current usage metrics is available 48-96 hours after online publication and is updated daily on week days.
Initial download of the metrics may take a while.