Fig. 10
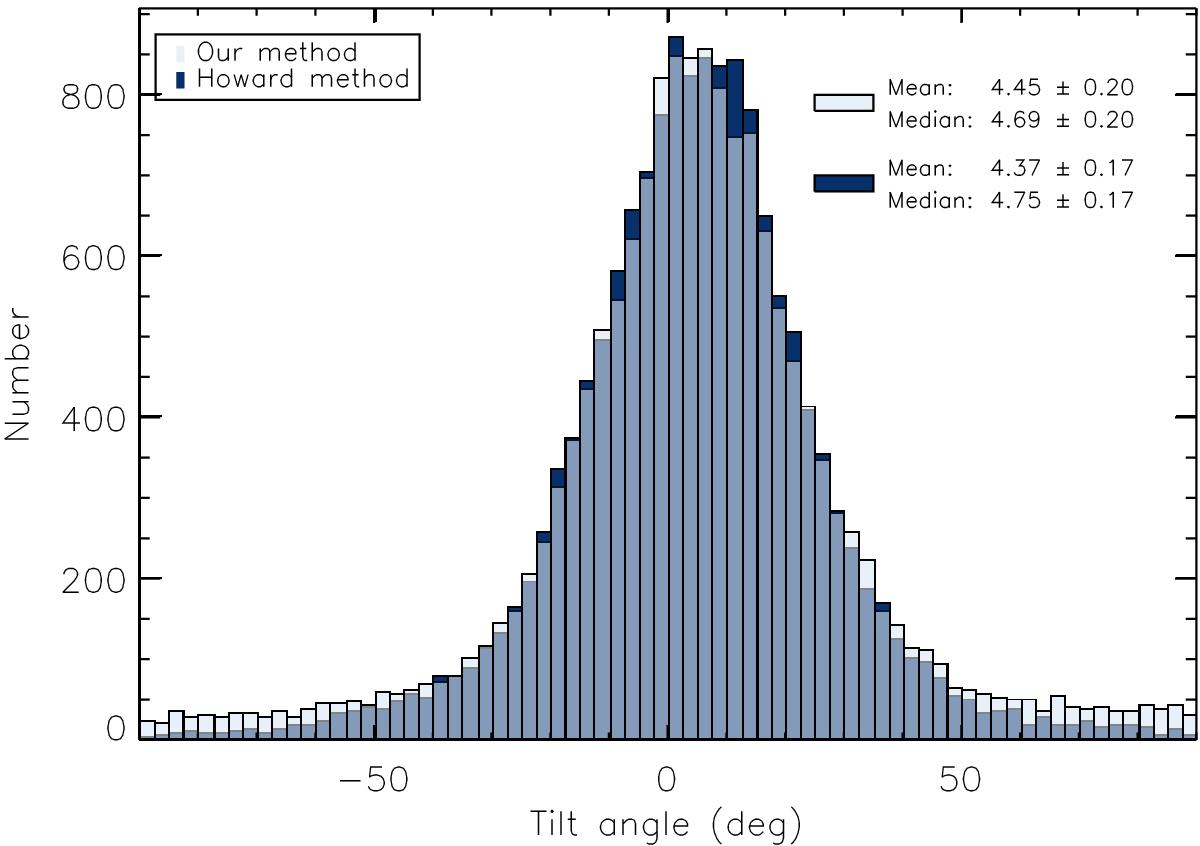
Histograms of the tilt angles in the Schwabe data, analysed with two different methods. Light bars show the excess of tilt angles from our isotropic method searching for the optimum polarity division, while dark bars show the excess of tilt angles from the method by Howard (1991). Only groups with area weighted centres within ± 60° CMD and polarity separations Δβ> 3° are used.
Current usage metrics show cumulative count of Article Views (full-text article views including HTML views, PDF and ePub downloads, according to the available data) and Abstracts Views on Vision4Press platform.
Data correspond to usage on the plateform after 2015. The current usage metrics is available 48-96 hours after online publication and is updated daily on week days.
Initial download of the metrics may take a while.