Fig. 2
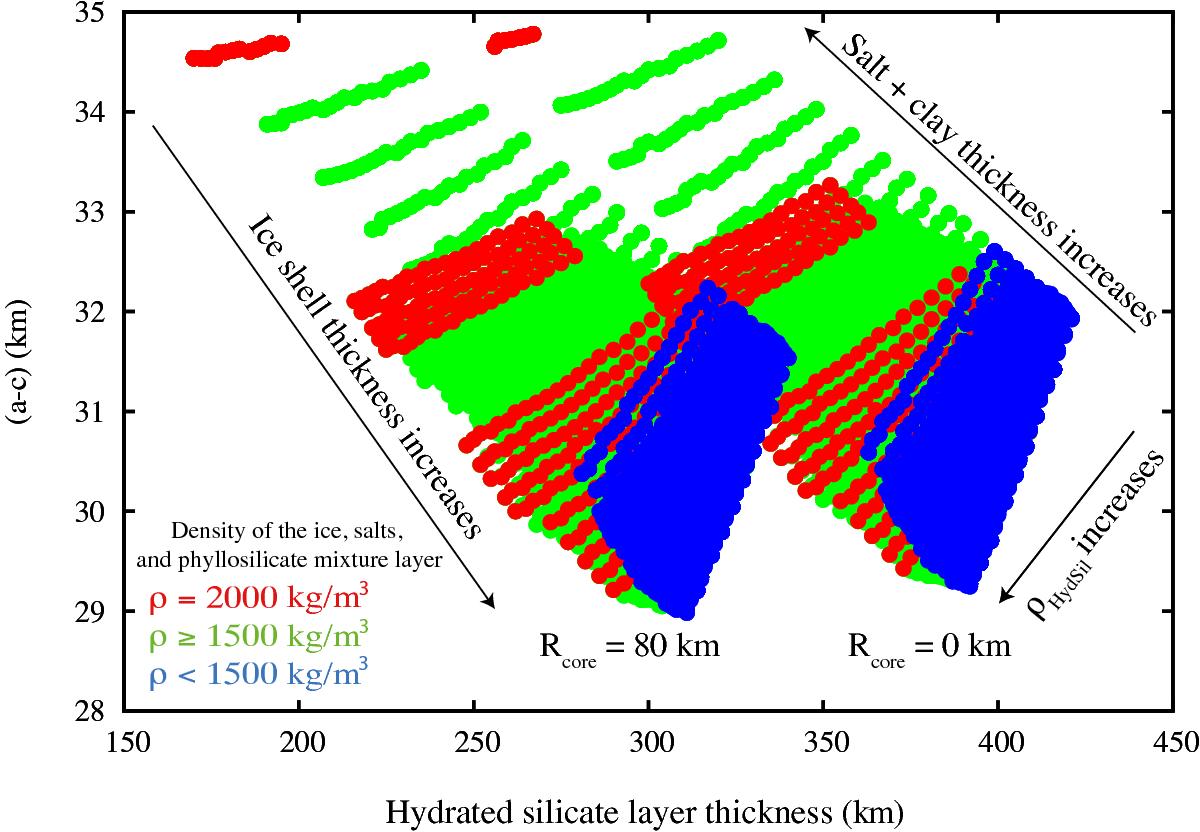
Differences between the equatorial and polar radii as a function of the thickness of the hydrated silicate layer for the broad parametric space described in Table 5 . Each dot corresponds to one model, and the dot separation shows the discretization used in the calculation. The blue dots correspond to models with a salt and phyllosilicate density below 1500 kg/m3, the green points to a density between 1500 kg/m3 and 2000 kg/m3, and red points to a density equal to 2000 kg/m3.
Current usage metrics show cumulative count of Article Views (full-text article views including HTML views, PDF and ePub downloads, according to the available data) and Abstracts Views on Vision4Press platform.
Data correspond to usage on the plateform after 2015. The current usage metrics is available 48-96 hours after online publication and is updated daily on week days.
Initial download of the metrics may take a while.