Fig. 3
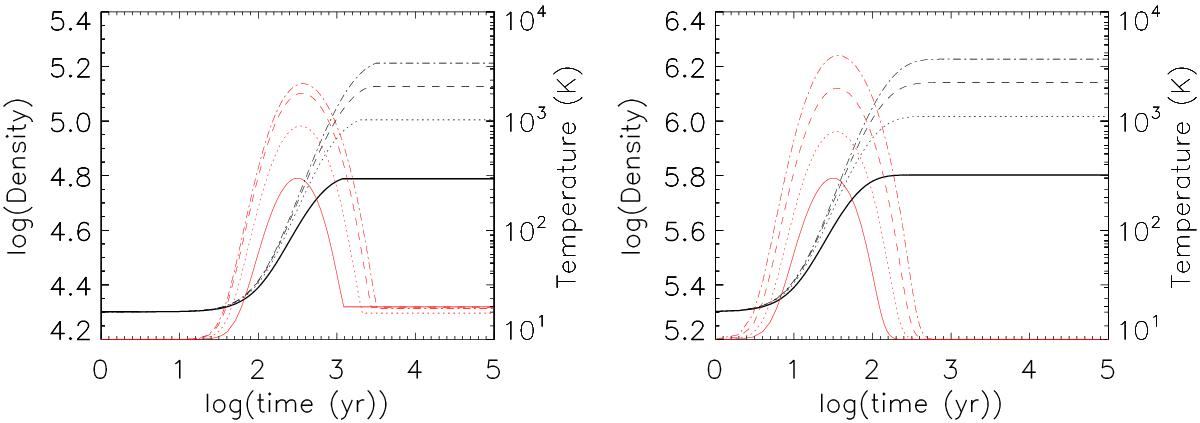
The temperatures (red lines with the scale on the right ordinate) and densities (black lines with the scale on the left ordinate) after the shock are shown for nH = 2 × 104cm-3 (left panel) and nH = 2 × 105cm-3 (right panel) with varying shock velocities of vs = 10, 20, 30, and 40 km s-1. Different velocities are indicated with solid lines (10 km s-1), dotted lines (20 km s-1), dashed lines (30 km s-1), and dash-dotted lines (40 km s-1).
Current usage metrics show cumulative count of Article Views (full-text article views including HTML views, PDF and ePub downloads, according to the available data) and Abstracts Views on Vision4Press platform.
Data correspond to usage on the plateform after 2015. The current usage metrics is available 48-96 hours after online publication and is updated daily on week days.
Initial download of the metrics may take a while.