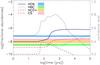
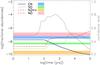
Fig. 11
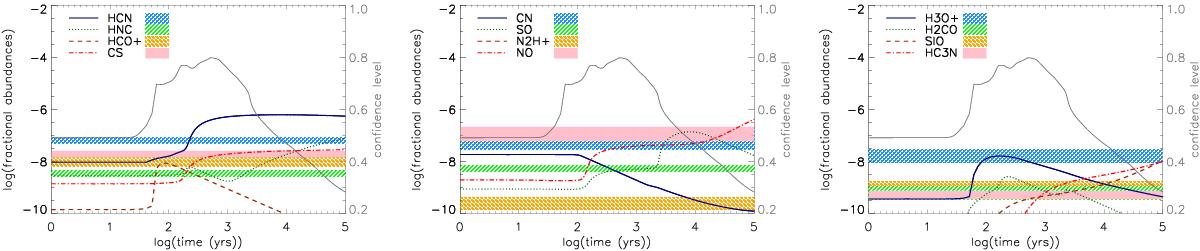
Time-averaged fractional abundances ⟨ X(t) ⟩ = ∫X(t′)dt′/t are shown with solid lines for nH = 2 × 104cm-3, ζ = 10-17s-1, and vs = 30 km s-1. Observed abundance ratios over total hydrogen abundance are shown as filled colors with the assumption of CO/Htot = 4 × 10⁻⁵. The gray line with the right ordinate scale shows the value of confidence level as a function of time.
Current usage metrics show cumulative count of Article Views (full-text article views including HTML views, PDF and ePub downloads, according to the available data) and Abstracts Views on Vision4Press platform.
Data correspond to usage on the plateform after 2015. The current usage metrics is available 48-96 hours after online publication and is updated daily on week days.
Initial download of the metrics may take a while.