Fig. 3
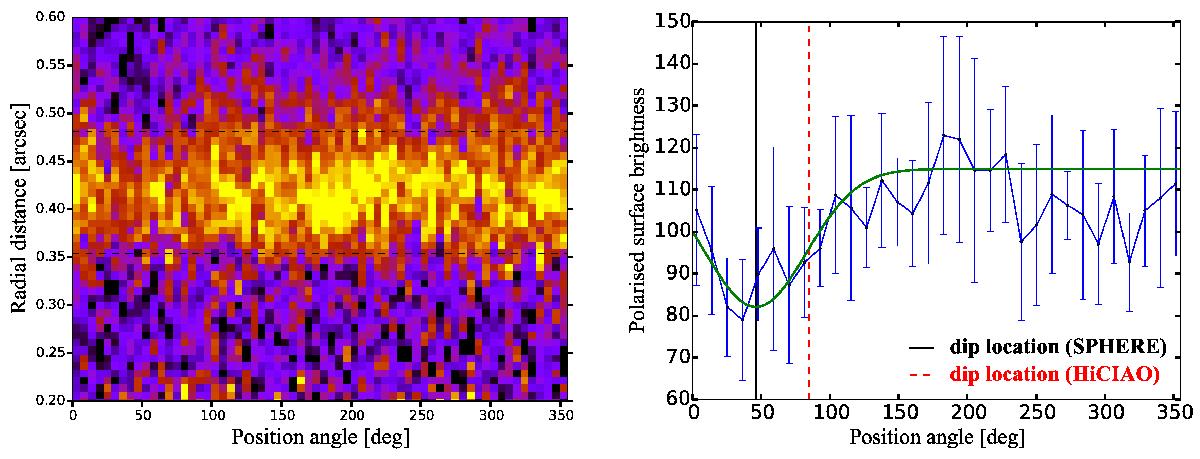
Left panel: radial mapping from 0.2–0.6 arcsec of the PI image of J1604 at R′ band. The colour scale is linear and arbitrary. Right panel: azimuthal profile calculated from the mean values obtained between [ 0.35−0.48 ] arcsec (dashed lines in the left panel and in the left panel of Fig. 1). The error bars are from the standard deviation of the data. The solid line represents the best fit of a Gaussian by χ2 minimisation. The vertical lines show the location of the minimum of the dip from our observations and from HiCIAO observations (Mayama et al. 2012).
Current usage metrics show cumulative count of Article Views (full-text article views including HTML views, PDF and ePub downloads, according to the available data) and Abstracts Views on Vision4Press platform.
Data correspond to usage on the plateform after 2015. The current usage metrics is available 48-96 hours after online publication and is updated daily on week days.
Initial download of the metrics may take a while.