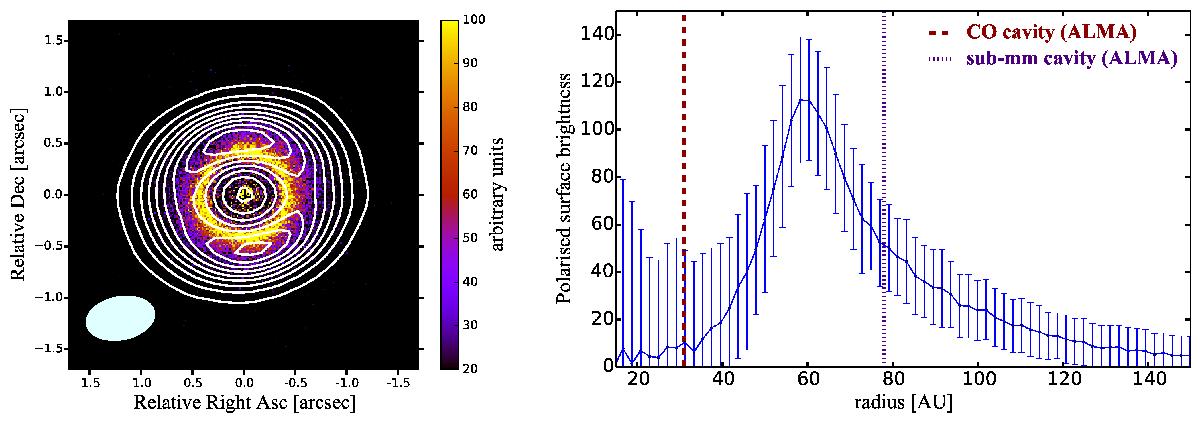
Fig. 2

Left panel: overlay of the R′ band (0.626 μm) Qφ reflected light (which is not scaled by r2) and 880 μm map from ALMA Cycle 0 observations (contour lines every 10...90% peak of the 880 μm continuum emission) of J1604. Right panel: radial profile of the polarised surface brightness (arbitrary units), and the comparison with the size of the mm-cavity observed with ALMA at 880 μm (Zhang et al. 2014). The cavity radius inferred from CO J = 3−2 emission is also displayed. The error bars correspond to the standard deviation at each position from calculating the mean value at each radius from the centre of the image.
Current usage metrics show cumulative count of Article Views (full-text article views including HTML views, PDF and ePub downloads, according to the available data) and Abstracts Views on Vision4Press platform.
Data correspond to usage on the plateform after 2015. The current usage metrics is available 48-96 hours after online publication and is updated daily on week days.
Initial download of the metrics may take a while.


