Free Access
Fig. 4
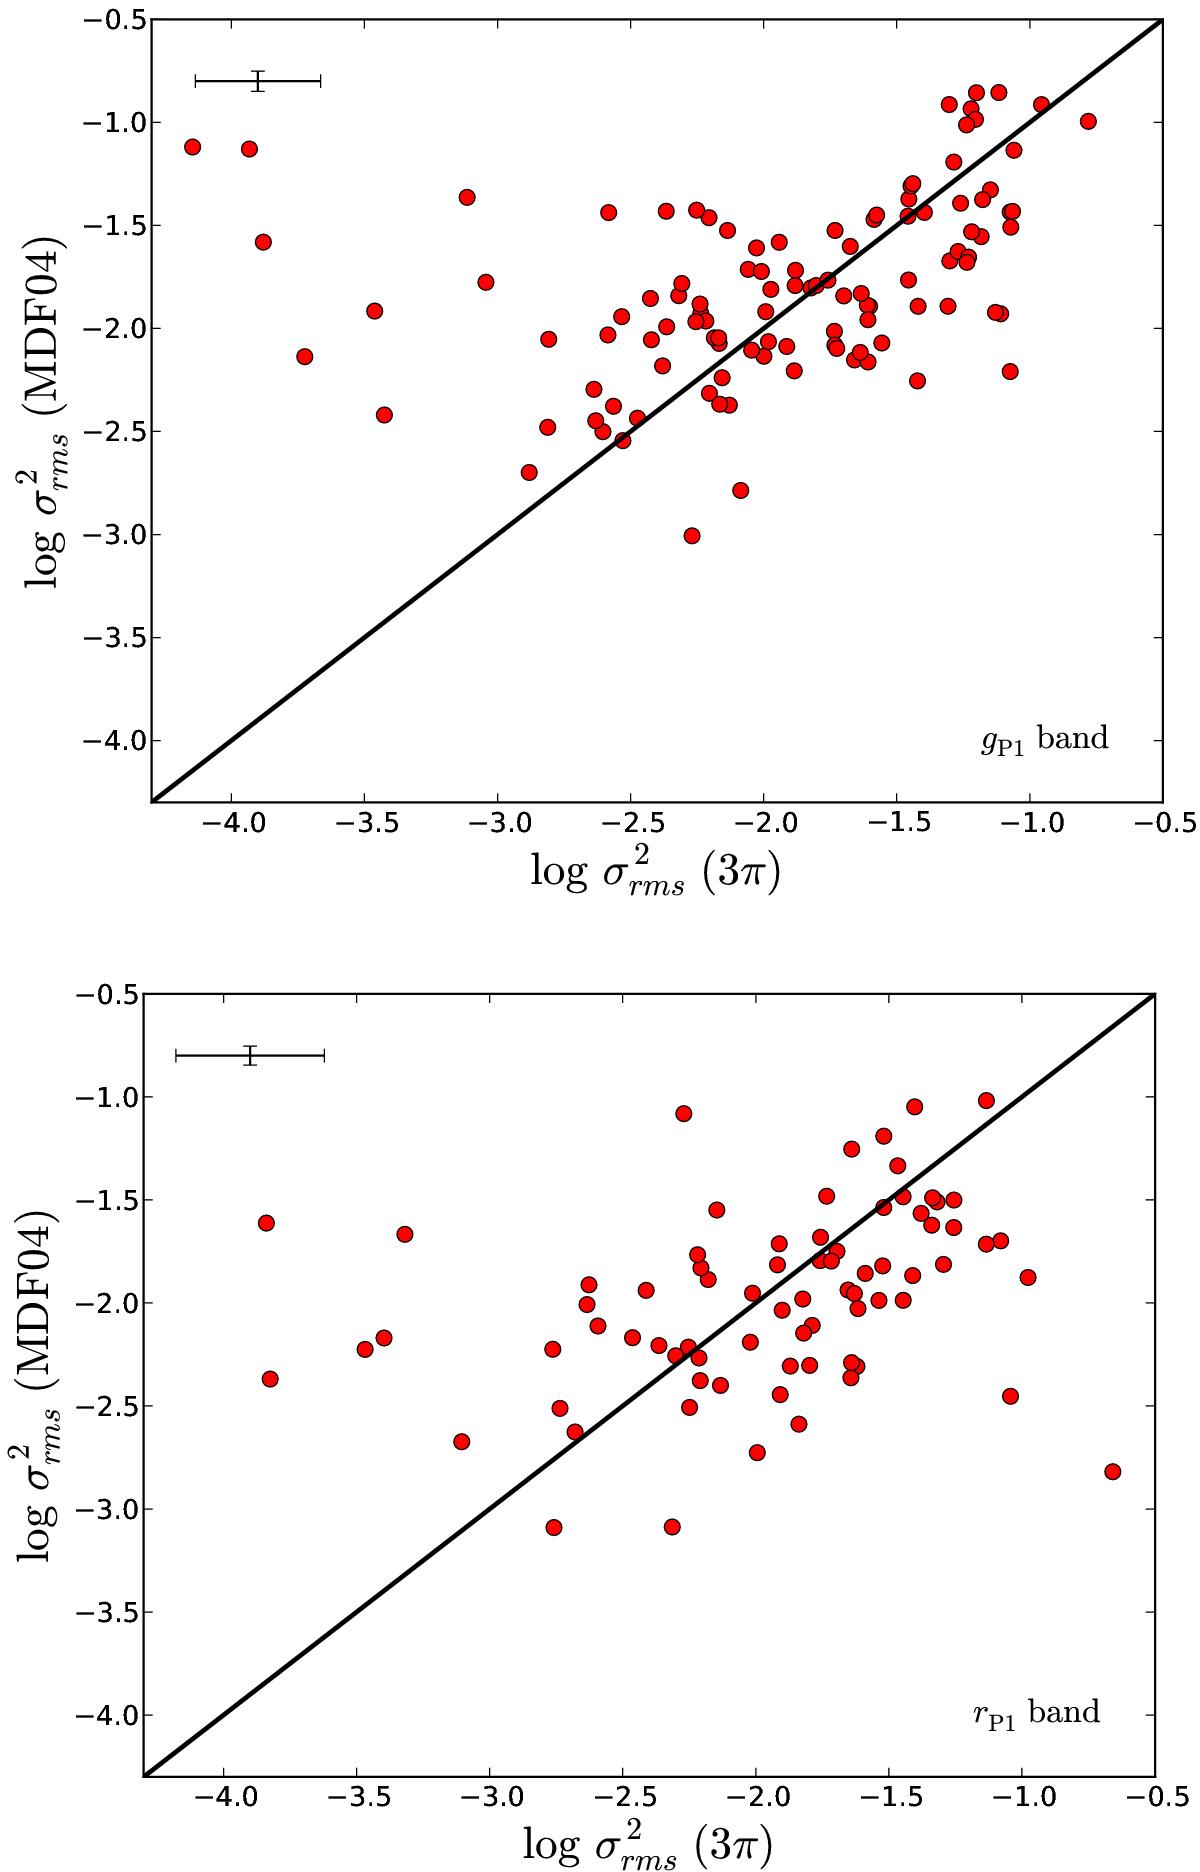
Excess variance calculated from the MDF04 light curves versus the respective value computed from the 3π light curves for all AGNs with ![]() in the gP1 band (top) and rP1 band (bottom). The black line represents the one-to-one relation, and the error bars show the average value of
in the gP1 band (top) and rP1 band (bottom). The black line represents the one-to-one relation, and the error bars show the average value of ![]() .
.
This figure is made of several images, please see below:
Current usage metrics show cumulative count of Article Views (full-text article views including HTML views, PDF and ePub downloads, according to the available data) and Abstracts Views on Vision4Press platform.
Data correspond to usage on the plateform after 2015. The current usage metrics is available 48-96 hours after online publication and is updated daily on week days.
Initial download of the metrics may take a while.