Free Access
Fig. A.1
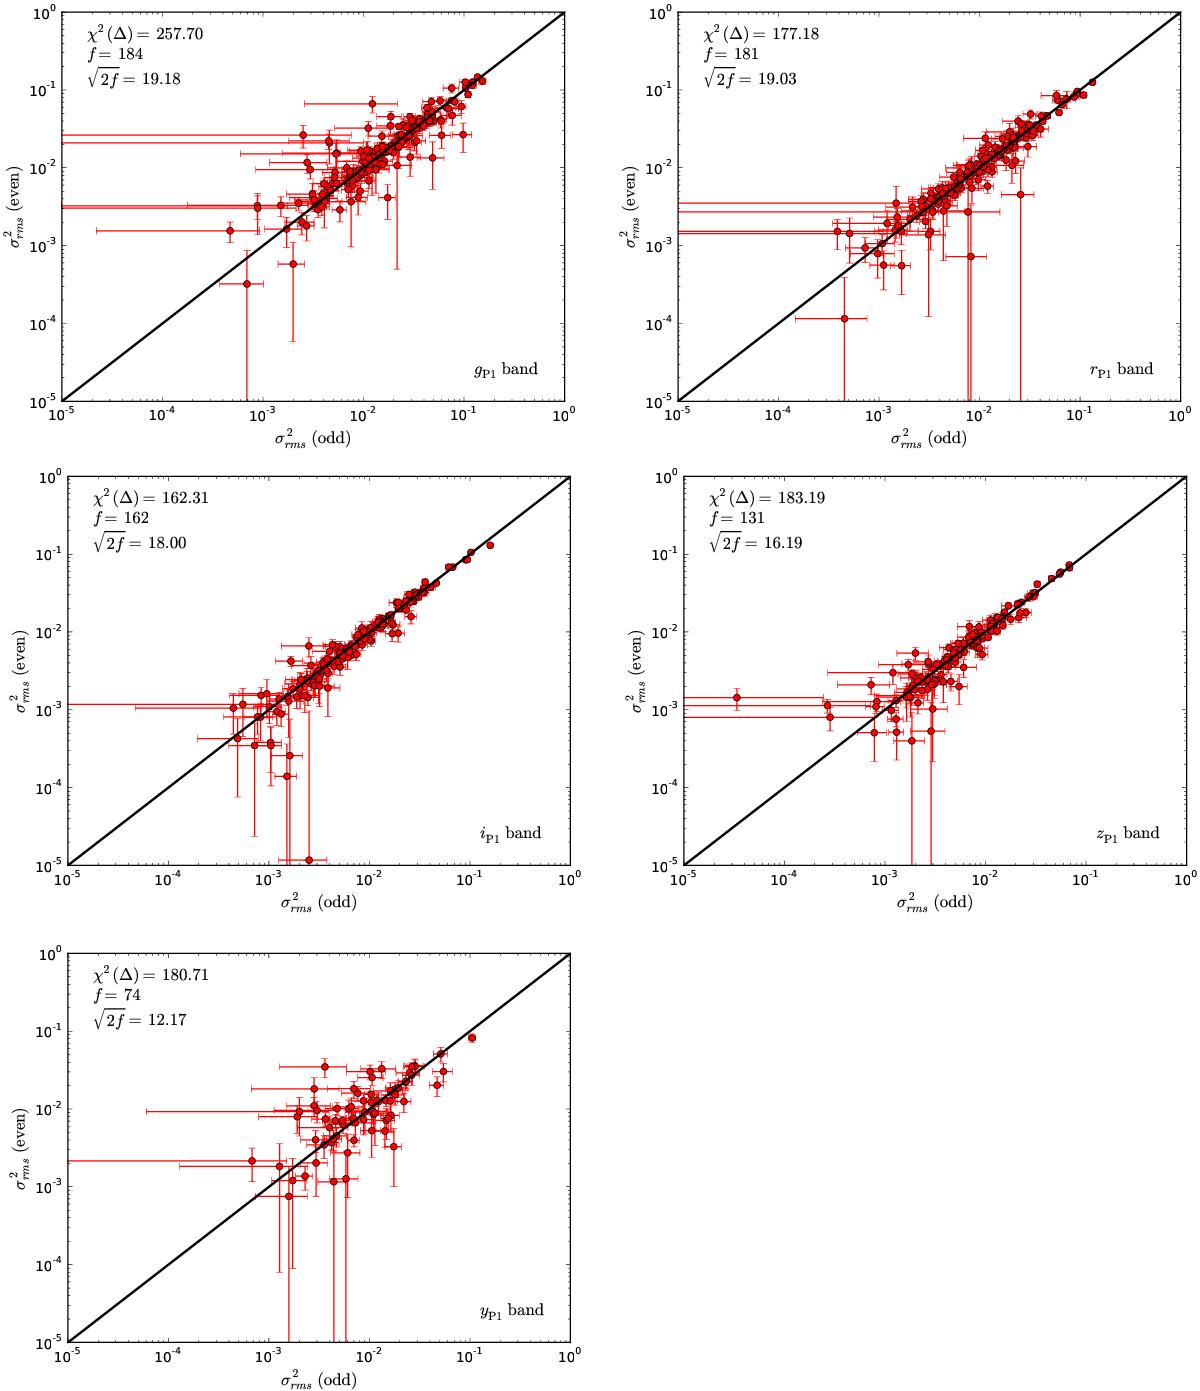
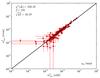
Excess variances of all PS1 bands calculated from only the even (y-axis) and only the odd (x-axis) light curve points for all variable AGNs of the MDF04 sample. Denoted is the χ2 of ![]() together with its expectation value and standard deviation. The black line corresponds to the one-to-one relation.
together with its expectation value and standard deviation. The black line corresponds to the one-to-one relation.
This figure is made of several images, please see below:

Current usage metrics show cumulative count of Article Views (full-text article views including HTML views, PDF and ePub downloads, according to the available data) and Abstracts Views on Vision4Press platform.
Data correspond to usage on the plateform after 2015. The current usage metrics is available 48-96 hours after online publication and is updated daily on week days.
Initial download of the metrics may take a while.