Fig. 6
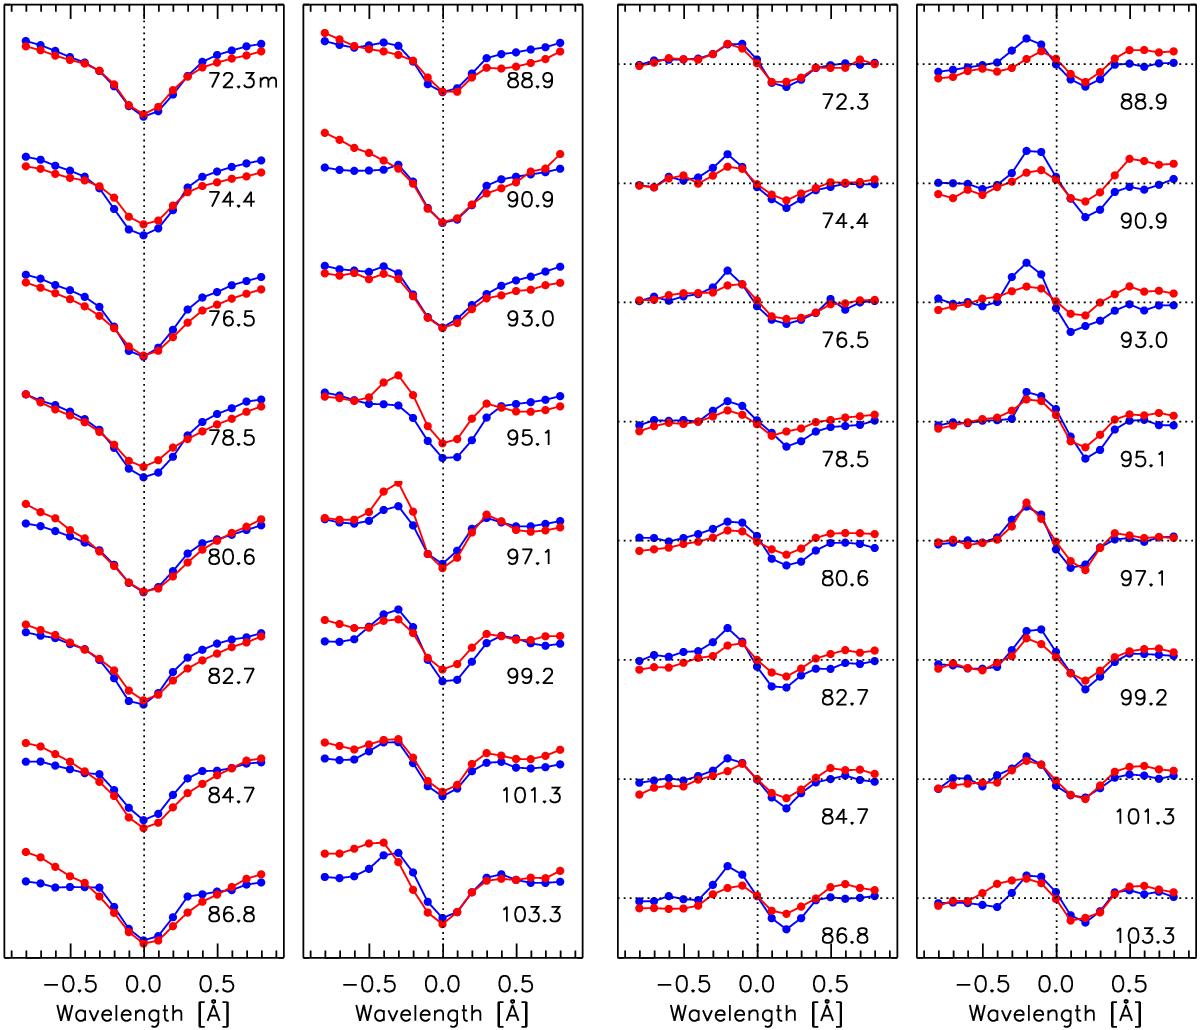
Temporal evolution of Ca ii 854.2 nm spectra in the blue and red patches (blue and red circles, respectively). Columns 1 and 2 correspond to Stokes I, while Cols. 3 and 4 correspond to Stokes V. Time increases from top to bottom and from left to right. The scaling of the y-axis in normalised intensity units is between (0.2,0.7) and (− 0.05,0.05) for the two Stokes parameters. The profiles come from the pixel with the highest average intensity between −300 and −400 mÅ.
Current usage metrics show cumulative count of Article Views (full-text article views including HTML views, PDF and ePub downloads, according to the available data) and Abstracts Views on Vision4Press platform.
Data correspond to usage on the plateform after 2015. The current usage metrics is available 48-96 hours after online publication and is updated daily on week days.
Initial download of the metrics may take a while.