Fig. 5
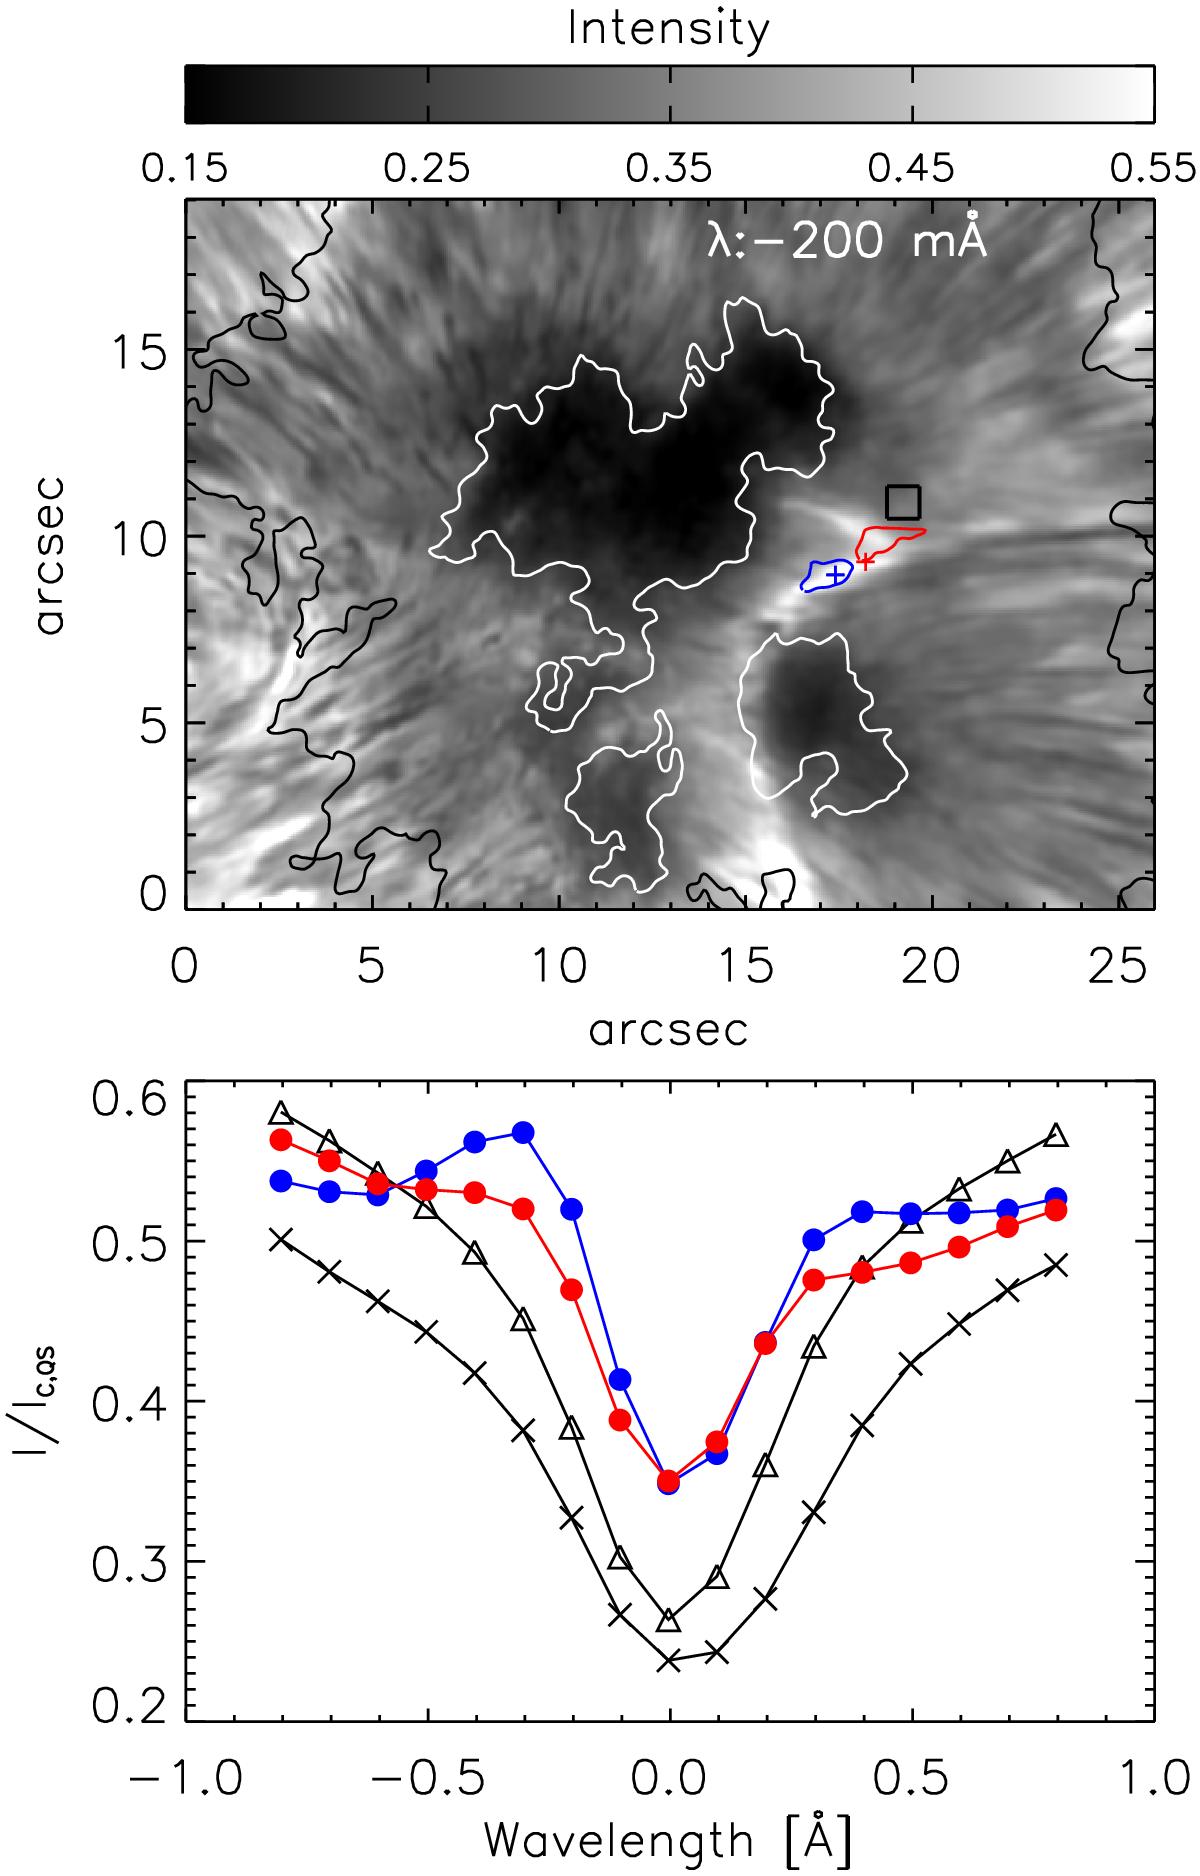
Intensity profile at the location of the brightening. Top panel: Ca filtergram at −200 mÅ from line centre at minute 99. The blue and red contours indicate the photospheric blueshifts and redshifts. The blue and red plus symbols refer to the pixels whose intensity profiles are shown in Fig. 6. Bottom panel: mean Ca intensity profile in the quiet Sun (crosses), blue patch (blue circles), red patch (red circles) and thick black square close to the brightening (triangles). The average profiles correspond to the scan at minute 99.
Current usage metrics show cumulative count of Article Views (full-text article views including HTML views, PDF and ePub downloads, according to the available data) and Abstracts Views on Vision4Press platform.
Data correspond to usage on the plateform after 2015. The current usage metrics is available 48-96 hours after online publication and is updated daily on week days.
Initial download of the metrics may take a while.