Fig. 2
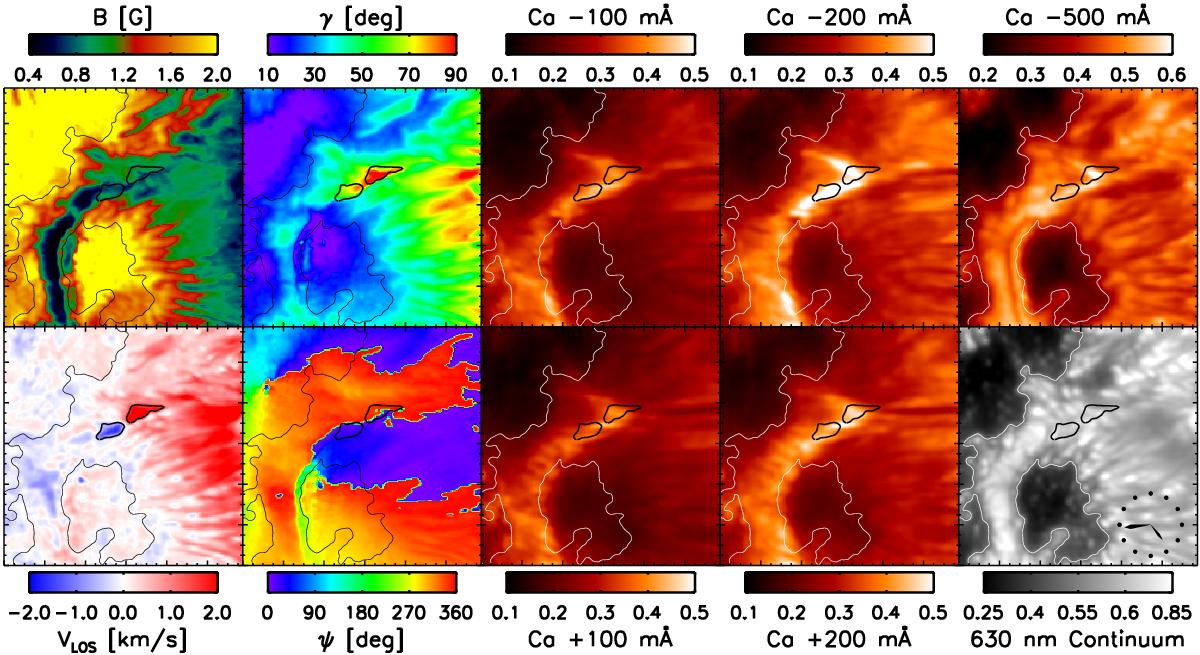
Physical parameters and Ca ii intensity filtergrams of the LB and its surroundings. The 12″ × 12″ field of view corresponds to the large square indicated in Fig. 1. Column 1: magnetic field strength (top) and Dopplergram from bisectors at the 70% intensity level (bottom). The field strength map corresponds to an optical depth of log τ = −1.0. Column 2: field inclination (top) and azimuth (bottom) in the local reference frame. Inclinations of 0° and 180° imply that the field is directed away from and into the solar surface, respectively. Zero azimuth is along the positive x-axis and increases in the counter-clockwise direction. Columns 3–5: intensity filtergrams at different wavelength positions of the Ca ii 854.2 nm line and the continuum image at 630 nm. All images have been scaled according to their respective colour bars. The maps correspond to scan number 97 acquired at 16:44 UT. The temporal evolution is shown in a movie available online.
Current usage metrics show cumulative count of Article Views (full-text article views including HTML views, PDF and ePub downloads, according to the available data) and Abstracts Views on Vision4Press platform.
Data correspond to usage on the plateform after 2015. The current usage metrics is available 48-96 hours after online publication and is updated daily on week days.
Initial download of the metrics may take a while.