Fig. 11
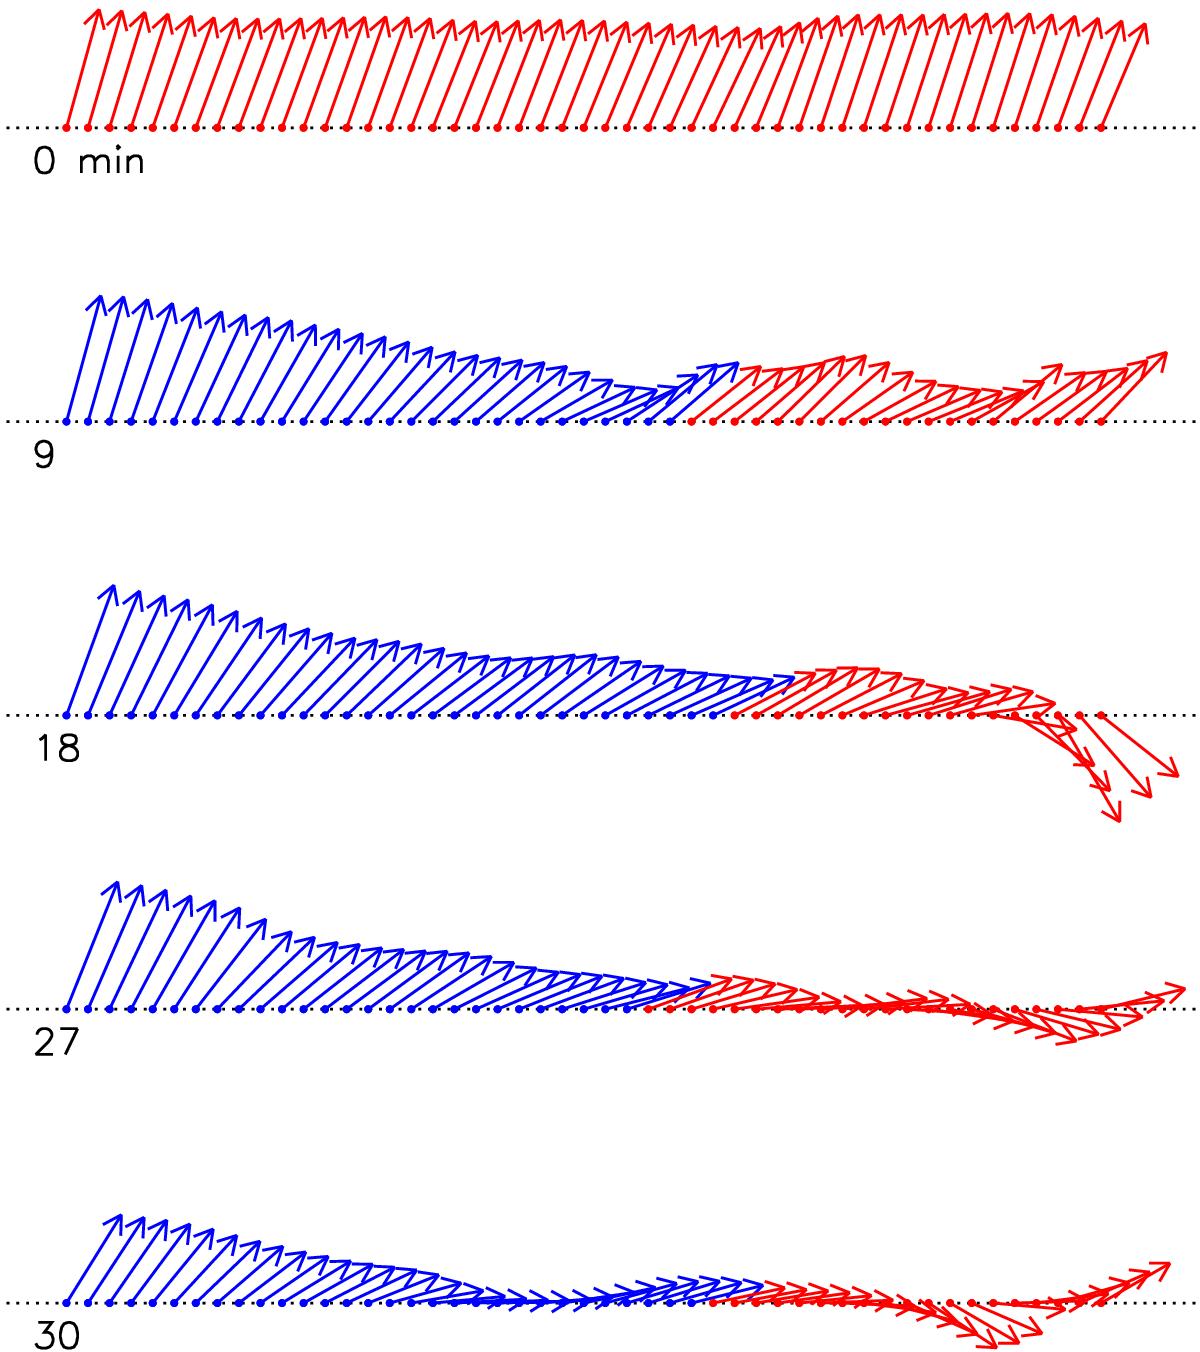
Sketch of the flat Ω-loop emerging in the light bridge. The arrows have been drawn for a cut passing along the blue and redshifted patches. The length and orientation of the arrows are proportional to the field strength and inclination inferred from the inversion. The start time corresponds to minute 72 of the time sequence.
Current usage metrics show cumulative count of Article Views (full-text article views including HTML views, PDF and ePub downloads, according to the available data) and Abstracts Views on Vision4Press platform.
Data correspond to usage on the plateform after 2015. The current usage metrics is available 48-96 hours after online publication and is updated daily on week days.
Initial download of the metrics may take a while.