Fig. 10
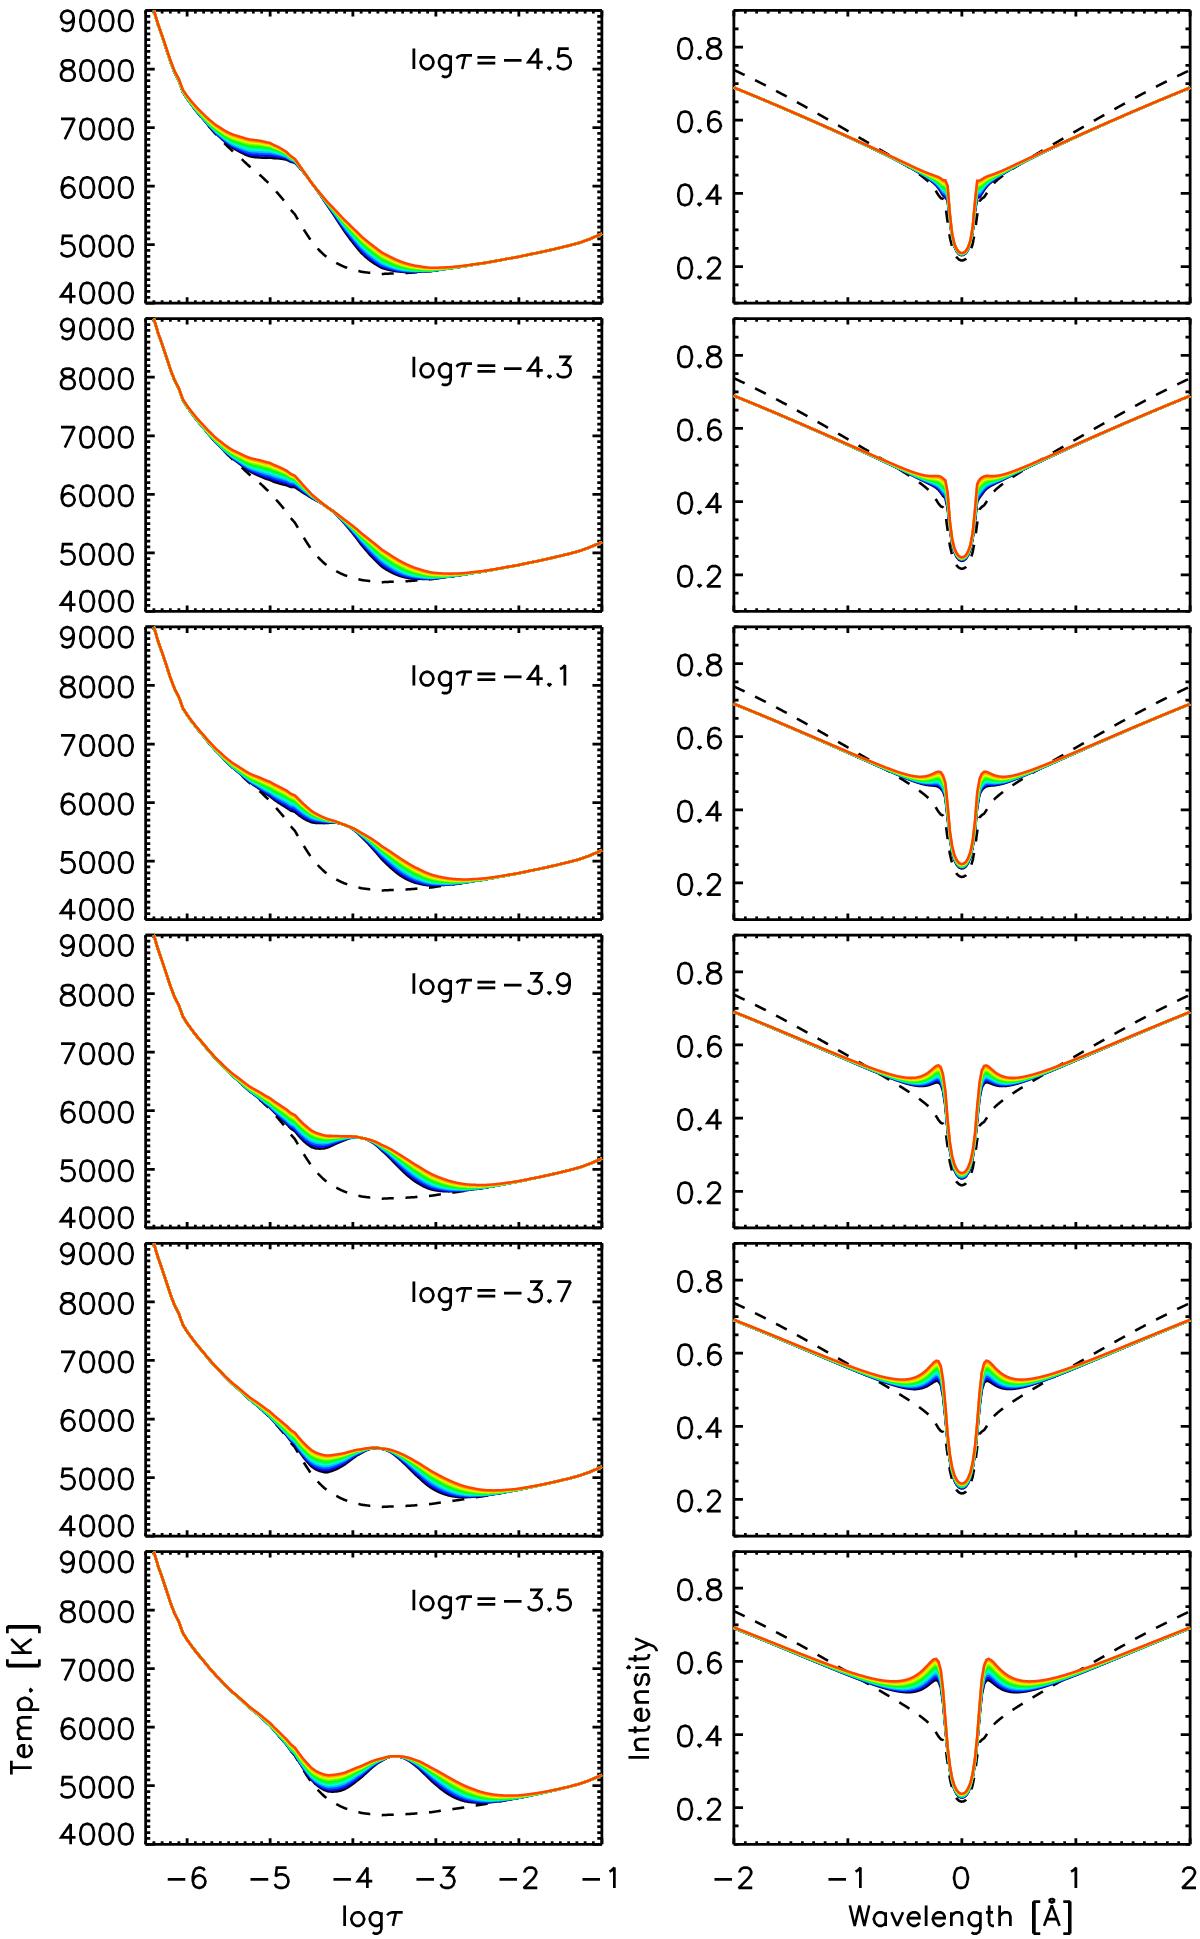
Ca ii 854.2 nm profiles emerging from the FALC model with perturbed temperatures. The left panels show a Gaussian temperature enhancement of 1000 K at various optical depths. In each panel, the colours represent different widths of the perturbation with blue and orange corresponding to Δlog τ = 0.4 and 0.6, respectively. The dashed line represents the unperturbed FALC atmosphere. The panels on the right are the corresponding intensity profiles calculated with NICOLE. The black dashed line shows the unperturbed profiles.
Current usage metrics show cumulative count of Article Views (full-text article views including HTML views, PDF and ePub downloads, according to the available data) and Abstracts Views on Vision4Press platform.
Data correspond to usage on the plateform after 2015. The current usage metrics is available 48-96 hours after online publication and is updated daily on week days.
Initial download of the metrics may take a while.