Fig. 8
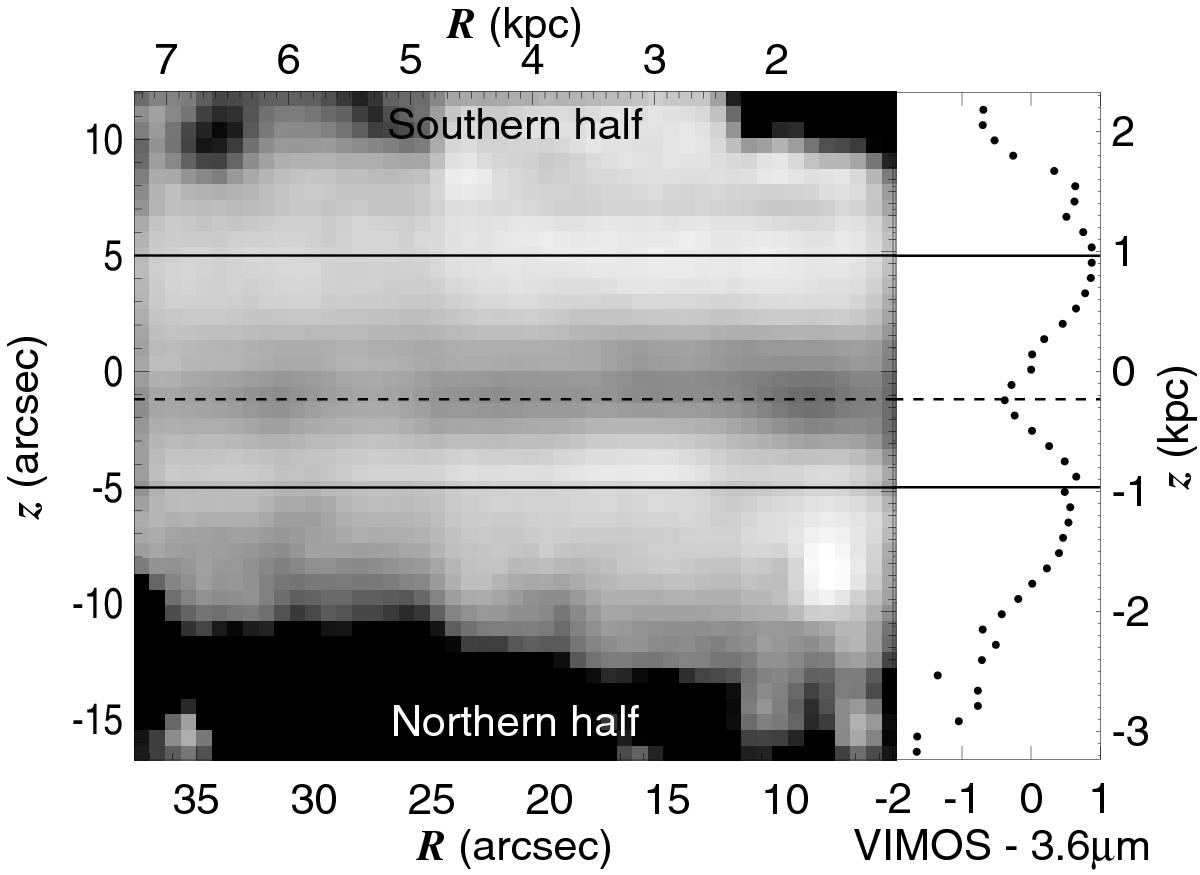
Left: VIMOS− 3.6 μm colour map. The VIMOS image was degraded to the S4G resolution. Right: median VIMOS− 3.6 μm as a function of the height with an arbitrary zero point. The solid horizontal lines indicate the height above which ~90% of the light comes from the thick disc. The dashed horizontal line indicates the reddest height within the thin disc dominated region.
Current usage metrics show cumulative count of Article Views (full-text article views including HTML views, PDF and ePub downloads, according to the available data) and Abstracts Views on Vision4Press platform.
Data correspond to usage on the plateform after 2015. The current usage metrics is available 48-96 hours after online publication and is updated daily on week days.
Initial download of the metrics may take a while.