Fig. 6
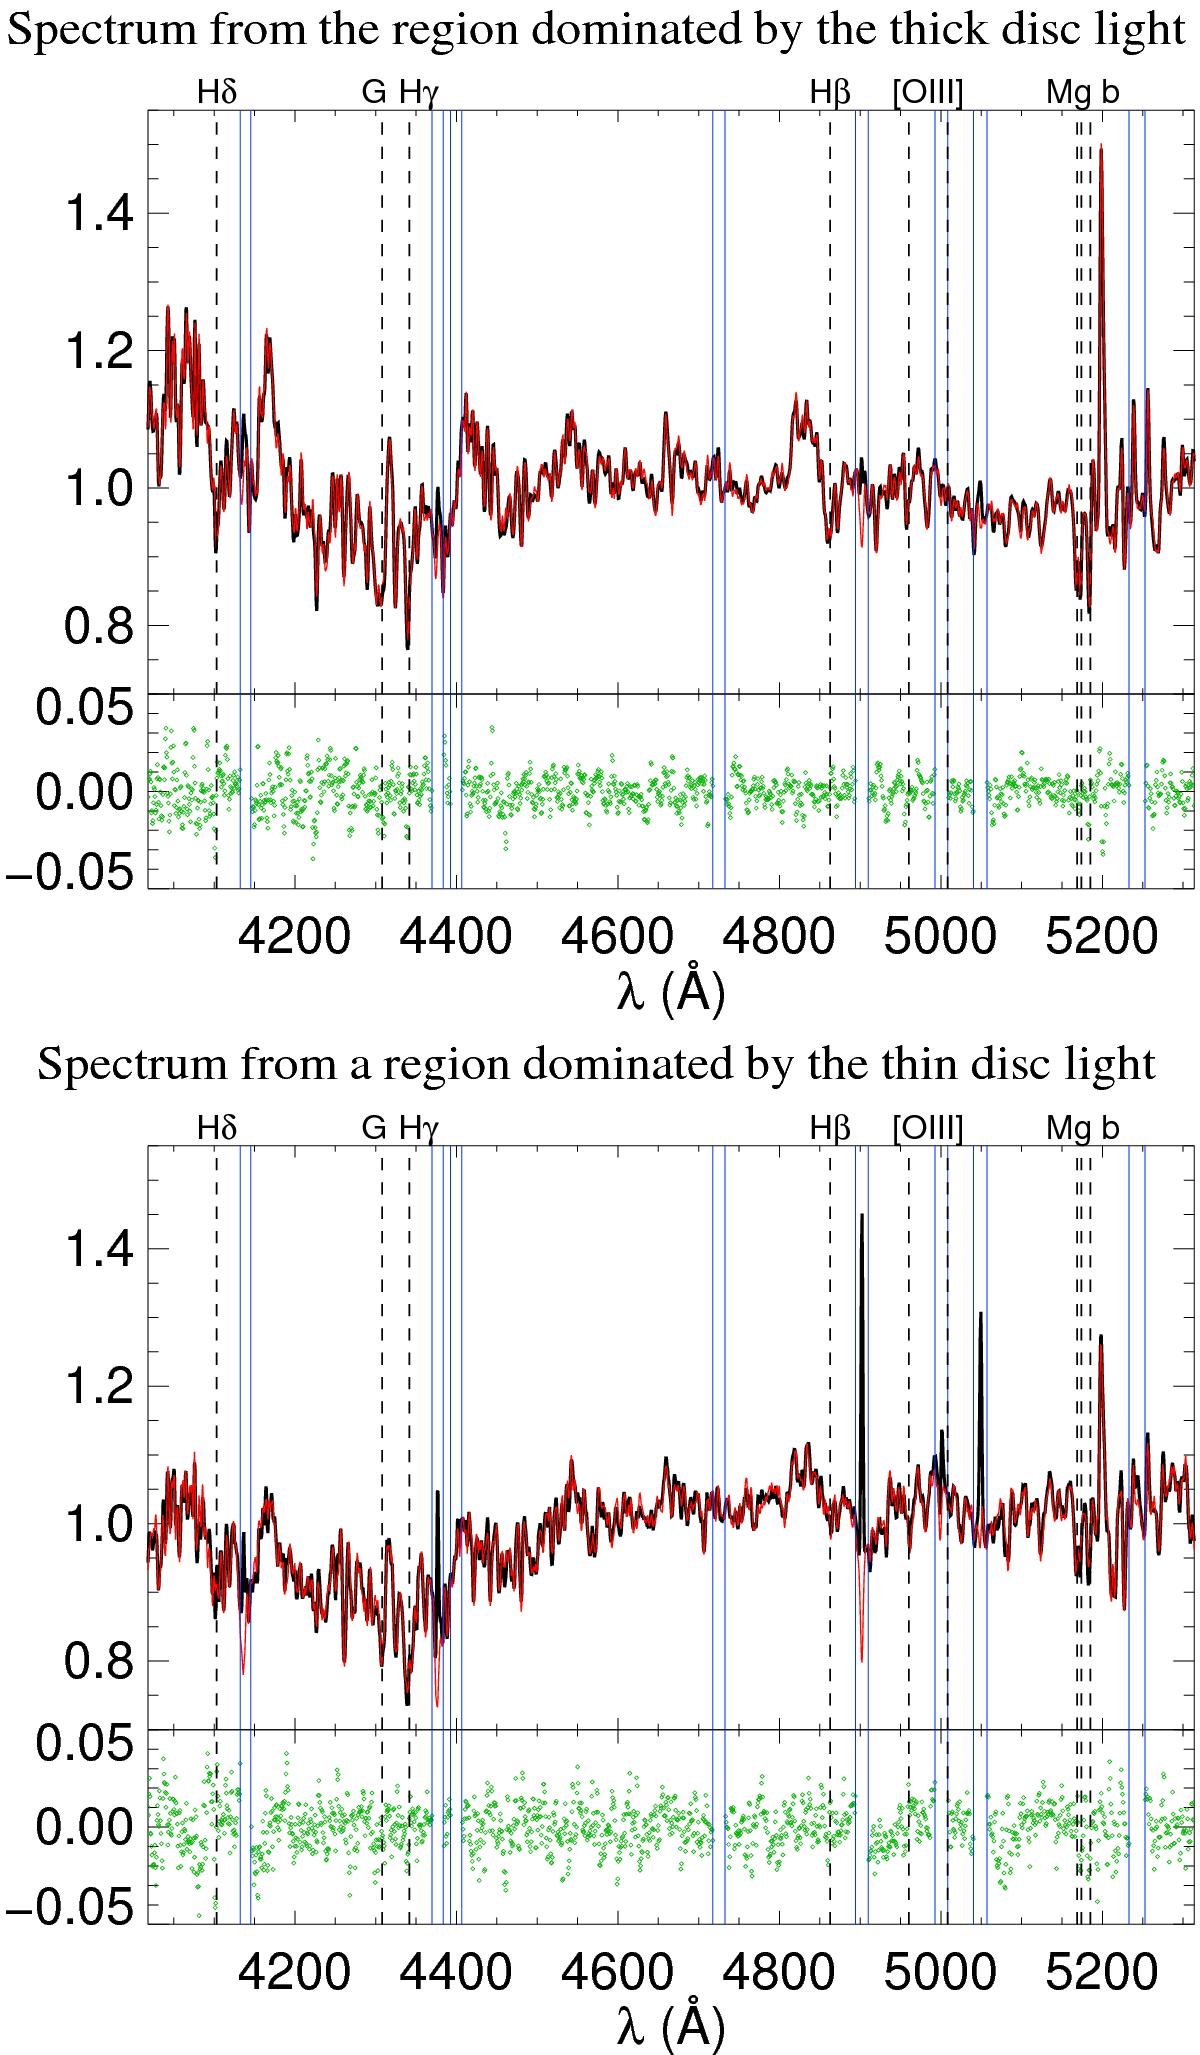
Two examples of rest-frame spectra obtained from our S/N ~ 80 tesselation. The black line corresponds to the actual spectrum, the red line corresponds to the fit, and the blue vertical lines indicate the spectral windows that were masked because of the possible presence of emission lines. Residuals are shown with green symbols below the spectra. The top spectrum belongs to the thick disc dominated region and the bottom spectrum to the rightmost thin disc dominated tile in Fig. 5. The spectra are normalized to their median value. Several spectral lines are indicated with dashed lines.
Current usage metrics show cumulative count of Article Views (full-text article views including HTML views, PDF and ePub downloads, according to the available data) and Abstracts Views on Vision4Press platform.
Data correspond to usage on the plateform after 2015. The current usage metrics is available 48-96 hours after online publication and is updated daily on week days.
Initial download of the metrics may take a while.